
1. License prerequisites
If you didn’t send it yet, please send us your Ninjatrader’s unique machine identifier using the form we sent in the “purchase receipt” email.
You can find your machine ID by opening your Ninjatrader software and going in the Help > About menu. Then copy / paste your machine ID in the form.
It is mandatory for us to enable your lifetime license in the licensing system.
Without doing this, your indicator will stop working after 3 days, and you will get a license warning message.
2. Indicator installation
Please refer to 1. Basic Ninjatrader indicator install page.
3. Add the indicator to a chart
Open a chart using the New > Chart menu from Ninjatrader. Then select your instrument in the Instrument list:
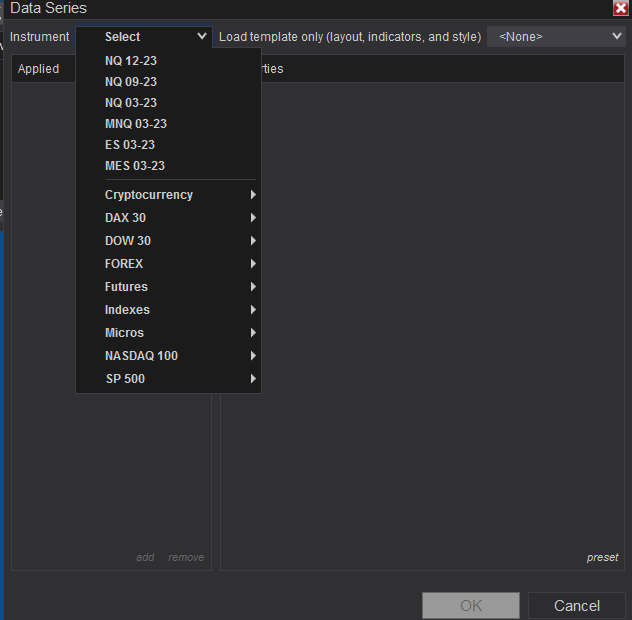
Then you will have to choose your timeframe.
Let’s say we will open a 1 minute chart from ES future contract for this example:
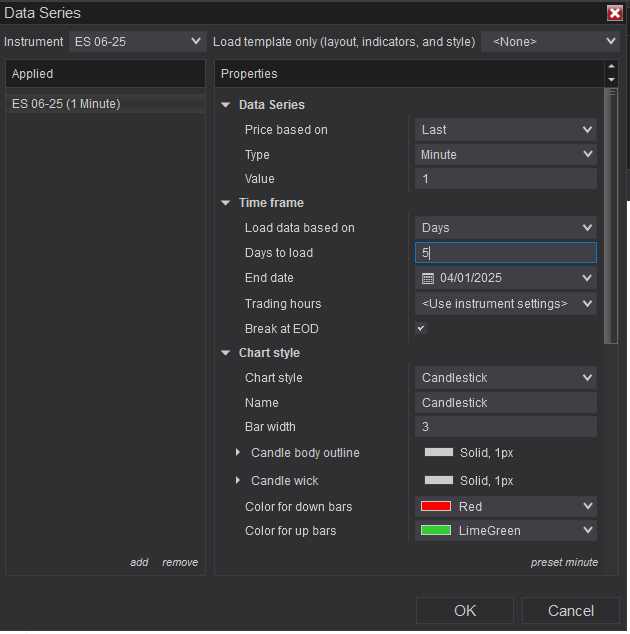
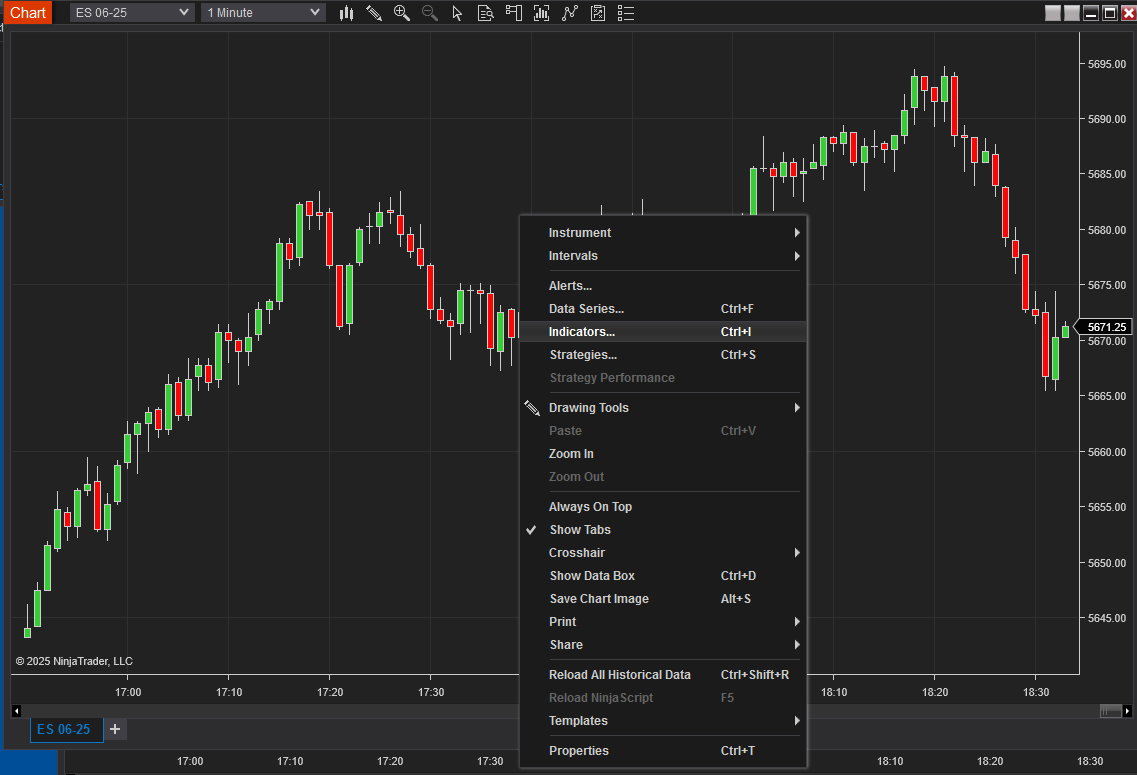
Click “OK” to open the chart and right click on your chart and choose “Indicators” :
On the top left, expand the “TradingRevealed” folder and double click on the “Trading-revealed.com.TRCumulativeDeltaPro” indicator to add it to the current chart indicators:
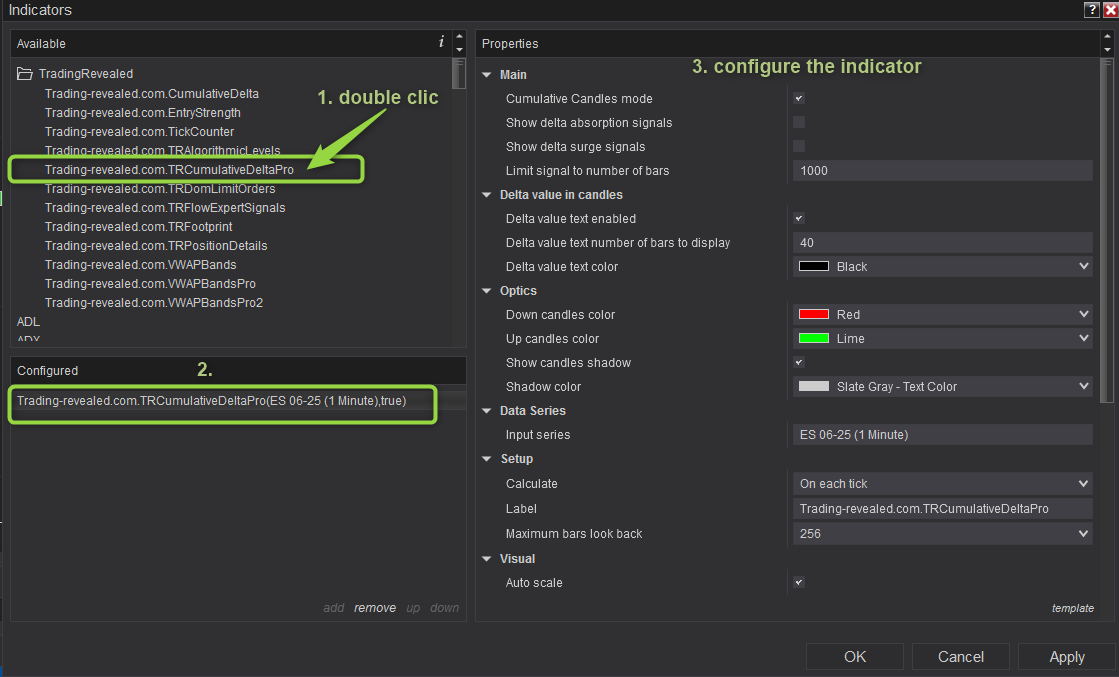
Then click on the indicator’s name from the “configured” section to display the settings on the right.
4. Input parameters full description
| Main Parameters | |
| Cumulative Candles mode | If checked, every new CVD candle will open where the previous one closed. And as such, the indicator will show the “cumulative” volume delta: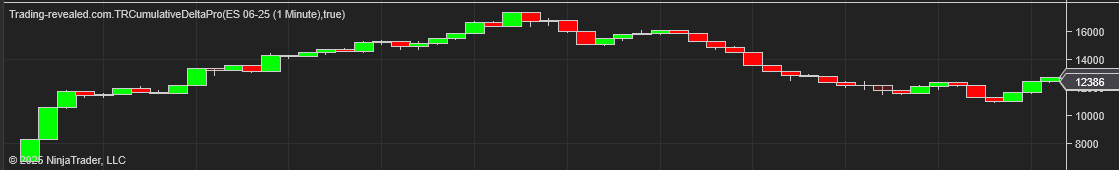 If not checked, the delta bars will be displayed candle by candle and reset to 0 at every new chart candle: 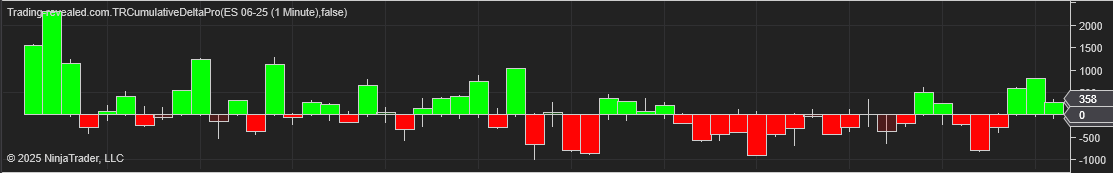 Both can be useful depending of your trading style. |
| Show delta absorption signals | If checked, some delta absorption signals arrows will be displayed in your main chart: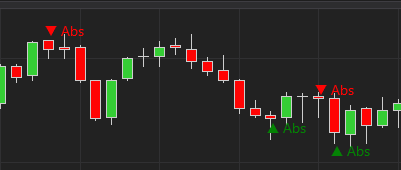 |
| Show delta surge signals | If checked, some delta surge signals (configuration where the delta is increasing from the last candles) will be displayed in your main chart: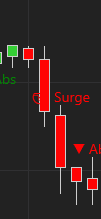 |
| Limit signal to number of bars | This one is used for performance only. It is set to 1000 by default to show the signals on the last 1000 candles only as we often don’t need more. You can increase it but be careful not to freeze your platform with too much signals. |
| Delta value in candles | |
| Delta value text enabled | if checked, this will display the bar delta value inside every bar. This is better to use with “non cumulative” delta bars for better readability: 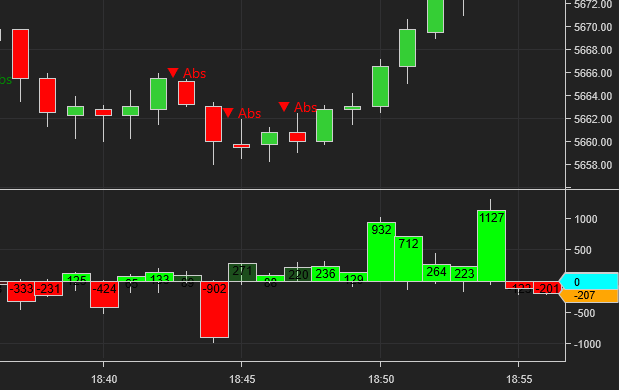 |
| Delta value text number of bars to display | This will limit the delta value display to the last number of candles configured here. This limit is there for performance purpose only, to keep your chart fast. |
| Delta value text color | The delta values text color |
| Optics | |
| Down candles color | The color for the down candles drawn by the indicator |
| Up candles color | The color for the up candles drawn by the indicator |
| Show candles shadow | If enabled, a shadow will be displayed around every candle |
| Shadow color | The candles shadow color |
5. Note on candle opacity showing absorption
There is feature that you won’t see anywhere else:
From time to time, you will see some more opaque green or red candles as shown in the following screenshot:
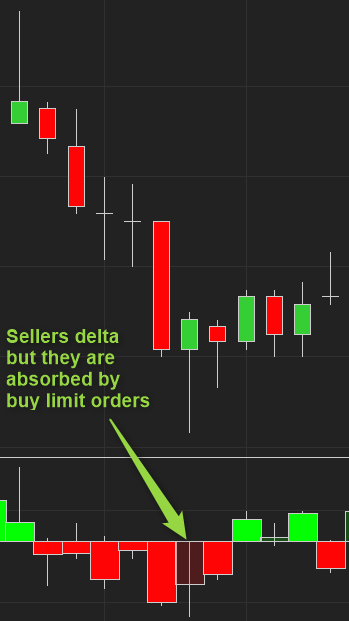
This is showing a red sellers delta but the agressive sellers that produced this red delta have been absorbed by passive buyers (buy limit orders).
It is a great visual help to see the absorption levels at a glance.
This documentation will be updated along the way.
Feel free to ask your question or send your suggestion by email or by commenting this post.

Leave a Reply