📊 SIGNALS & MEANINGS
| Signal on chart | Meaning | Visual / Zone Color |
|---|---|---|
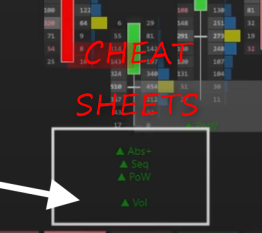
| abs | Absorption detected (buyers or sellers absorbing aggressive orders) | Orange (Passive Sellers) / Blue (Passive Buyers) |
| abs+ | Bigger absorption than usual (stronger passive buyers/sellers absorption) | Orange (Passive Sellers) / Blue (Passive Buyers) |
| seq | Orders sequencing zone (indicates potential price control by one side) | Gray Zone + Candle Color Gray + Bearish Candle = Sell Seq Gray + Bullish Candle = Buy Seq |
| pow | Point of Control (POC) located in the candle’s wick. It means the price where most volume was exchanged → suggests the price where most volume was exchanged (POC) has been rejected | (POC is the candle volume line in yellow) |
| imb | Imbalances inside the candle: More buyers than sellers (buy imbalance) or vice versa (sell imbalance) at price levels | Green Zone = Aggressive Buyers Red Zone = Aggressive Sellers |
| vol | Big candle volume (spike in traded volume) | – |
🟦 ZONE COLORS & WHAT THEY MEAN
| Zone Color | Represents |
|---|---|
| 🟩 Green | Aggressive Buyers Imbalance (buying strength) |
| 🟥 Red | Aggressive Sellers Imbalance (selling strength) |
| 🟧 Orange | Passive Sellers Absorption (absorbing buyers) |
| 🟦 Blue | Passive Buyers Absorption (absorbing sellers) |
| ⚫ Gray | Orders Sequencing Zone Context: Bullish or Bearish Candle |
💡 QUICK INTERPRETATION TIPS
- abs / abs+: Someone is quietly absorbing aggressive market orders → look for potential reversals or traps.
- seq: Orders are being placed in sequence to defend a level → combine candle direction with zone color for bias.
- pow: POC in wick → price rejected at a high-volume area → possible turning point.
- imb: Strong imbalance at specific price levels → expect continuation or fast moves. Depending on the context, an imbalance zone can show a “stop run” (stop loss orders hit)
- vol: Unusually high volume candle → significant interest at that level, look for follow-through or exhaustion.

Leave a Reply