
1. License prerequisites
If you didn’t send it yet, please send us your Ninjatrader’s unique machine identifier using the form we sent in the “purchase receipt” email.
You can find your machine ID by opening your Ninjatrader software and going in the Help > About menu. Then copy / paste your machine ID in the form.
It is mandatory for us to enable your lifetime license in the licensing system.
Without doing this, your indicator will stop working after 3 days, and you will get a license warning message.
2. Indicator installation
Please refer to 1. Basic Ninjatrader indicator install page.
3. Add the indicator to a chart
Open a chart using the New > Chart menu from Ninjatrader. Then select your instrument in the Instrument list:
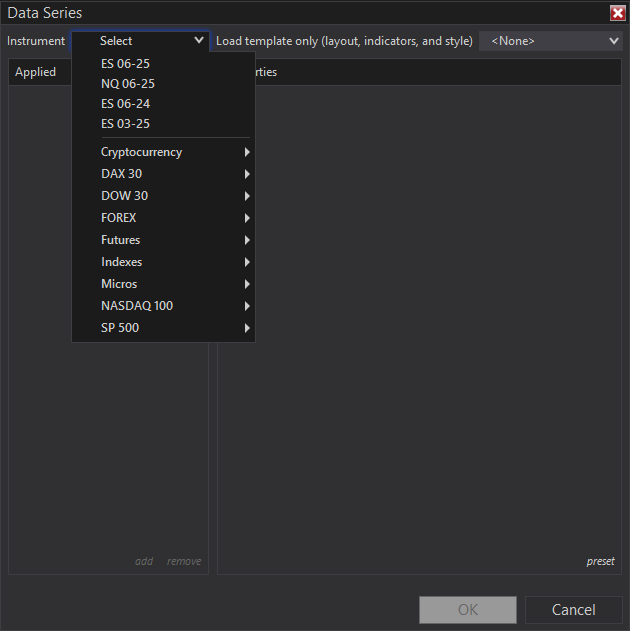
Then you will have to choose your timeframe.
You can choose a standard timeframe like M1, M5, M15 etc., it will work. But you will often see me using range bars instead of this for footprint charts. And I advise you to use range bars actually.
The reason is simple: using range bars, the candles will be time independant and every candle will have the same size. It will allow you to : gauge the market speed, you brain will get use to trade the same kind of candles every time, comparing volume/volume delta between candles will be more relevant, and so on.
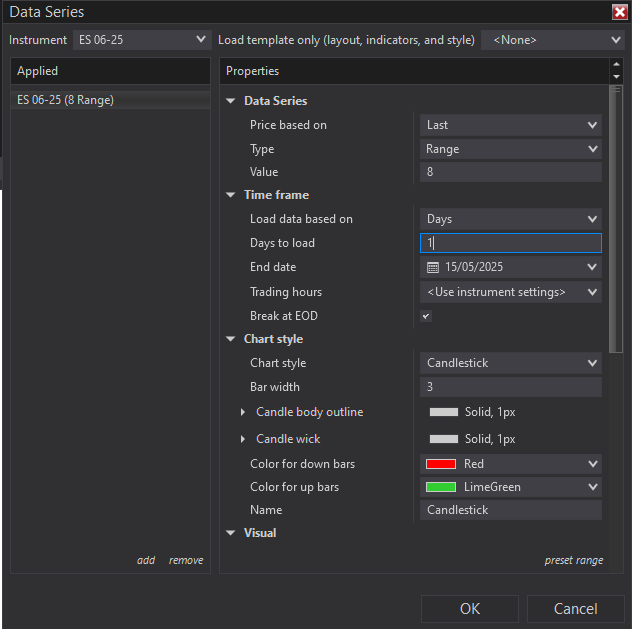
Choose a range bar number relevant to your instrument, you don’t want to get 50 candles per second which would be unreadable, and you don’t want to get 1 candle every hour neither 🙂
For instance for ES I find the range bar 8 to be relevant usually, and it could be increased a bit when there’s a high market volatility.
Don’t load too much days for your short term entry chart for performance, 1 day should be enough in most case actually. The configuration would be like this:
Then you can right click on your chart, choose “Indicators“, expand the “TradingRevealed” folder and double click on the “Trading-revealed.com.TRFootprint” indicator to add it to the current chart indicators:
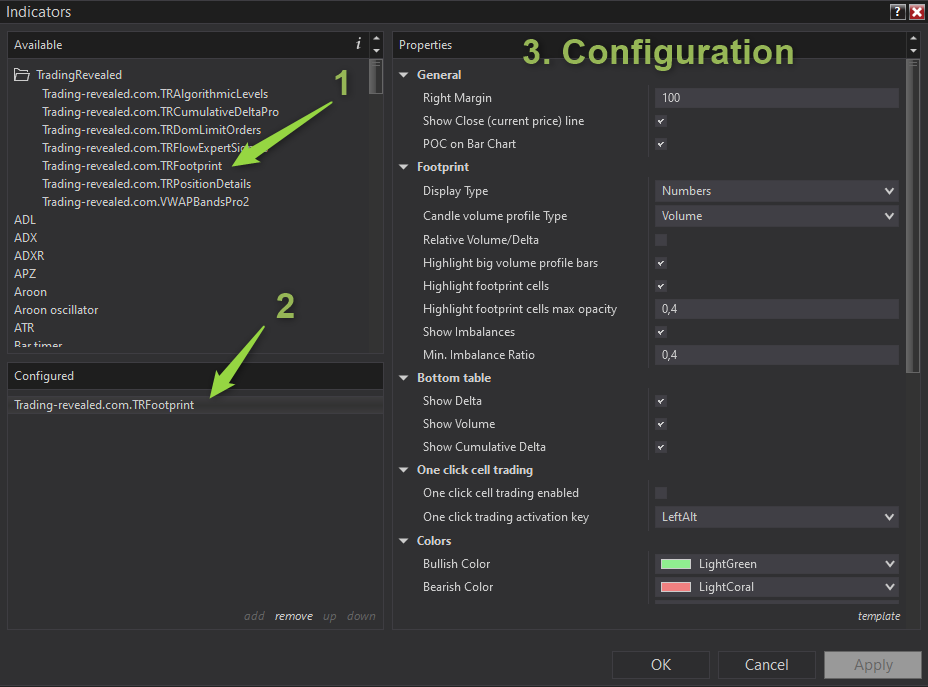
Then click on the indicator’s name from the “configured” (2.) section to display the settings on the right.
If you want to tweak the parameters, please see the input parameters in the following chapter.
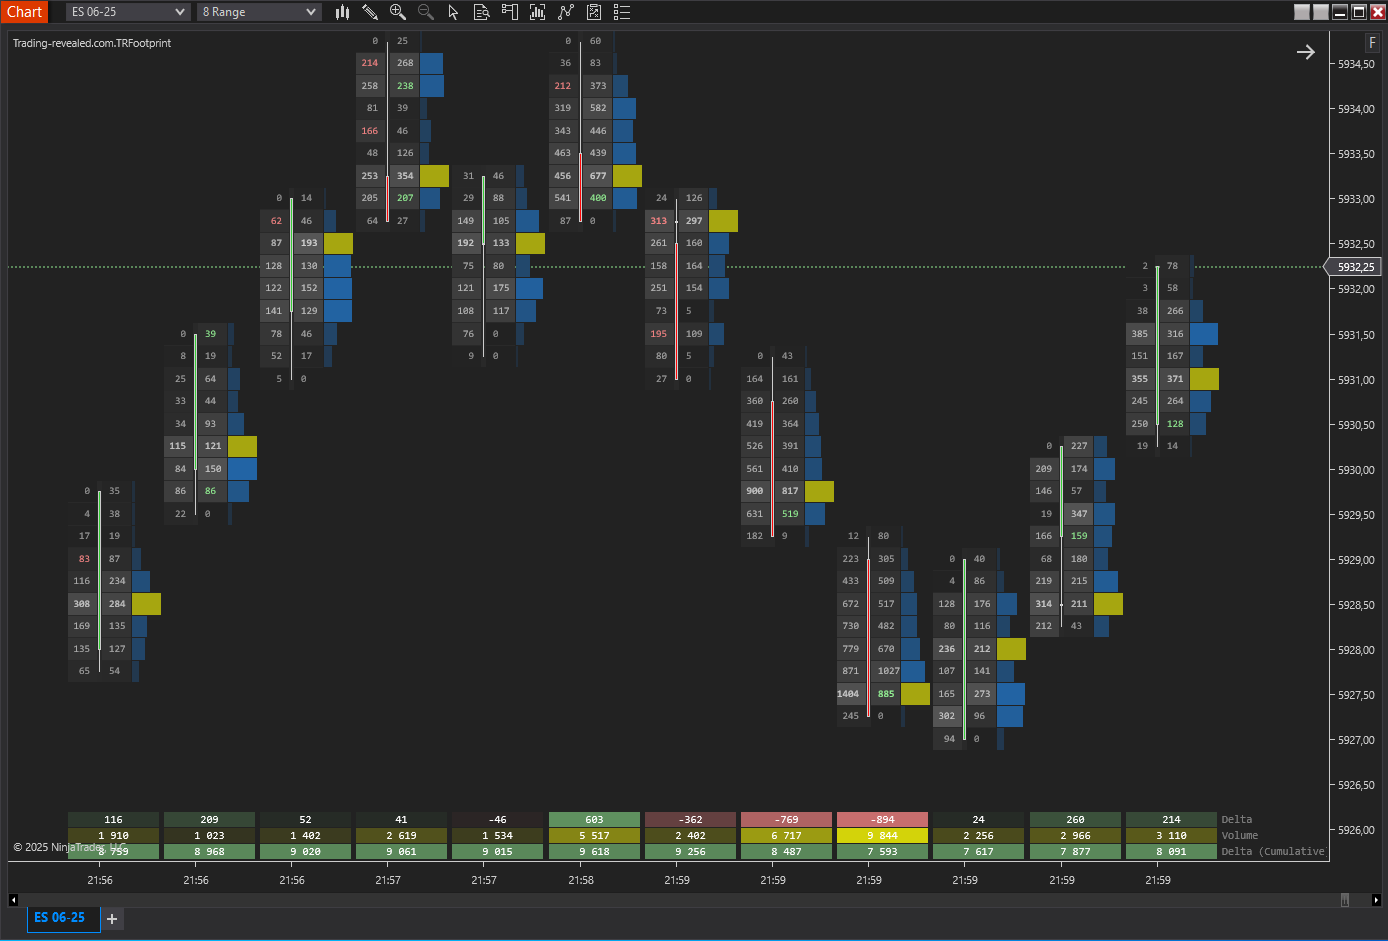
And if you go with default settings, if you click “ok”, you should get a chart like this:
🔧 Input Parameters
🧾 General Settings
| Parameter | Description |
|---|---|
| Right Margin (default: 100) | Horizontal space (pixels) on the right side of the chart for clearer display of the last candle |
| Show Close (current price) line (default: checked) | Displays the real-time price line on the chart.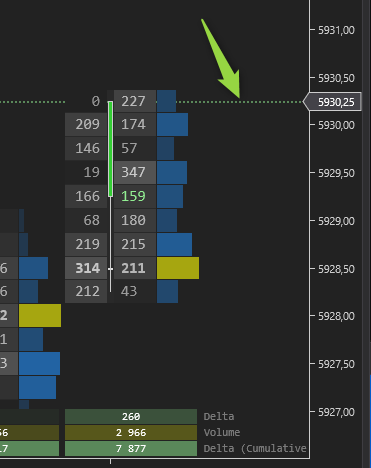 |
| POC on Bar Chart (default: checked) | Overlays the Point of Control (POC) on traditional bar charts (when you unzoom).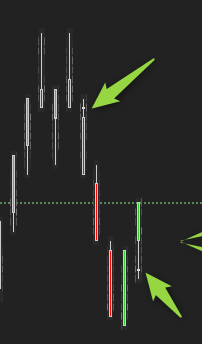 |
🔍 Footprint Display Options
| Parameter | Description |
|---|---|
| Display Type (default: Numbers) | Selects the main layout type: – Numbers to get a classic footprint chart with numbers – Profile to get a volume (or delta: see next parameter) profile only |
| Candle volume profile Type (default: volume) | Determines how the candle volume profile is rendered: – Volume: classic volume profile 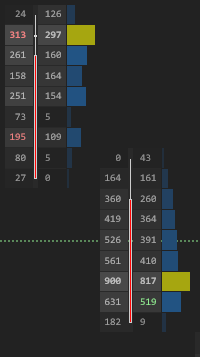 – Delta: displays the delta strength at every price line 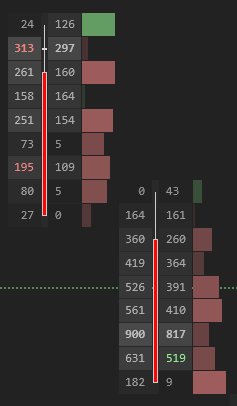 – None: when you don’t want any volume profile 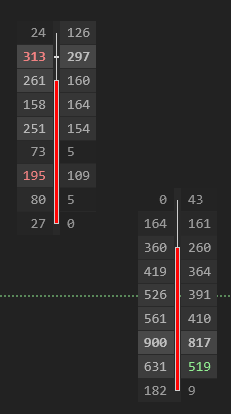 |
| Relative Volume/Delta (default: unchecked) | Displays volume/delta profiles strength relative to the candles displayed on screen. Allows to highlight candles with higher relative volume.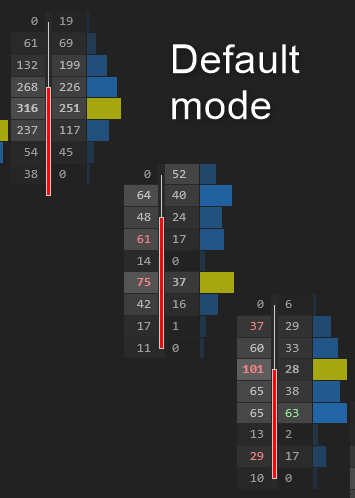 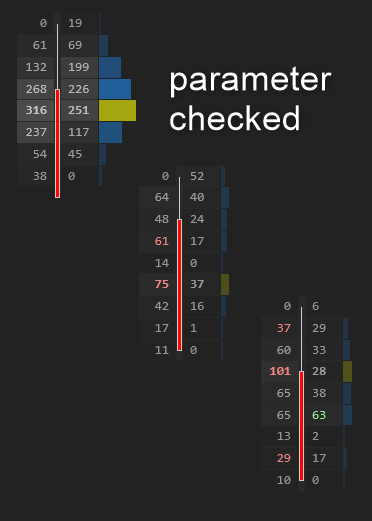 |
| Highlight big volume profile bars (default: checked) | Highlights bars with unusually high volume in the profile. |
| Highlight footprint cells (default: checked) | Highlights individual price cells based that have the bigger traded volume.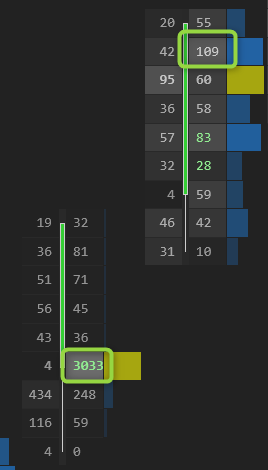 |
| Highlight footprint cells max opacity (default: 0,4) | Sets the maximum opacity for footprint cell highlights. Increase it a bit to increase the cell highlighting, and decrease it a bit for less highlighting. |
| Show Imbalances (default: true) | Enables visual display of buy/sell imbalances (meaning aggressive buyers/sellers).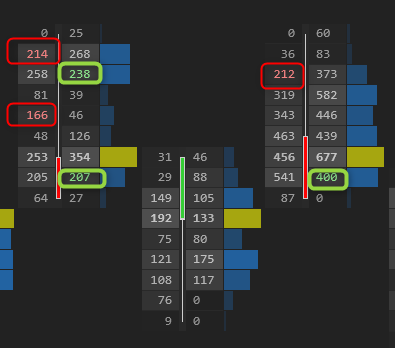 |
| Min. Imbalance Ratio (default: 0,4) | Defines the threshold ratio to trigger imbalance highlighting. Imbalance is calculated in diagonal: traded volume at ask(n+1) / traded volume at bid(n) must be > than the ratio for sell imbalance |
📉 Bottom Table Display

| Parameter | Description |
|---|---|
| Show Delta (default: true) | Displays per-candle delta (Buy – Sell volume). |
| Show Volume (default: true) | Displays total volume traded per candle. |
| Show Cumulative Delta (default: true) | Displays session-wide cumulative delta beneath the chart. |
🖱️ One-Click Cell Trading
Note: this feature is still in beta, use it at your own risk and test it in sim to master it before any live trading.
| Parameter | Description |
|---|---|
| One click cell trading enabled (default: unchecked) | Enables execution of orders directly from footprint cells (like in a price ladder): – Hold the activation key + click on a bid cell below current price => will open a buy limit order – Hold the activation key + click on a ask cell above current price => will open a sell limit order – Hold the activation key + click on a bid cell above current price => will open a buy stop order – Hold the activation key + click on a ask cell above current price => will open a sell stop order |
| One click trading activation key (default: LeftAlt) | Defines the keyboard key that must be holded during your click to place an order |
🎨 Color Customization
| Parameter | Description |
|---|---|
| Bullish Color (default: LightGreen) | Cell color for buyers |
| Bearish Color (default: LightCoral) | Cell color for sellers |
| Neutral Color (default: White) | Cell color for balanced or low-activity cells. |
| Stats table numbers Color (default: Yellow) | Base color for numbers in the statistics table at the bottom. |
| Numbers Color (default: Gainsboro) | General number color inside footprint cells. |
| Map Color (default: DodgerBlue) | Voume profiles shading color overlay for volume/delta intensities. |
| POC Color (default: Yellow) | Line or bar color for the Point of Control (highest volume price). |
📊 Visual Output
- Footprint candles can render volume and delta at each price level.
- Highlighting tools allow quick detection of imbalances and high-volume nodes.
- Optional stats table shows delta, volume, and cumulative delta in a panel below the chart.
- POC is marked visually for each candle or session.
- Heatmaps and opacity scaling reveal market aggression and structure.
🧠 Usage Tips
- Set
Min Imbalance Ratioof 0.6–0.8 for high-precision detection if needed. - Use
Relative Volume/Deltawhen analyzing multi-session charts for normalization. - Activate OneClickTrading in fast-paced environments for instant order placement directly from footprint cells.
- Customize bullish/bearish/neutral colors for better contrast depending on chart background.
This documentation will be updated along the way.
Feel free to ask your question or send your suggestion by email or by commenting this post.

Leave a Reply