
TRPositionDetails is a custom NinjaTrader indicator designed to provide enhanced visibility into open trade positions. It overlays detailed PnL metrics (in ticks, points, currency, or percentage) directly onto your chart and includes customizable UI and color settings for seamless integration with your trading layout.
1. License prerequisites
If you didn’t send it yet, please send us your Ninjatrader’s unique machine identifier using the form we sent in the “purchase receipt” email.
You can find your machine ID by opening your Ninjatrader software and going in the Help > About menu. Then copy / paste your machine ID in the form.
It is mandatory for us to enable your lifetime license in the licensing system.
Without doing this, your indicator will stop working after 3 days, and you will get a license warning message.
2. Indicator installation
Please refer to 1. Basic Ninjatrader indicator install page.
3. Add the indicator to a chart
Open a chart using the New > Chart menu from Ninjatrader. Then select your instrument in the Instrument list:
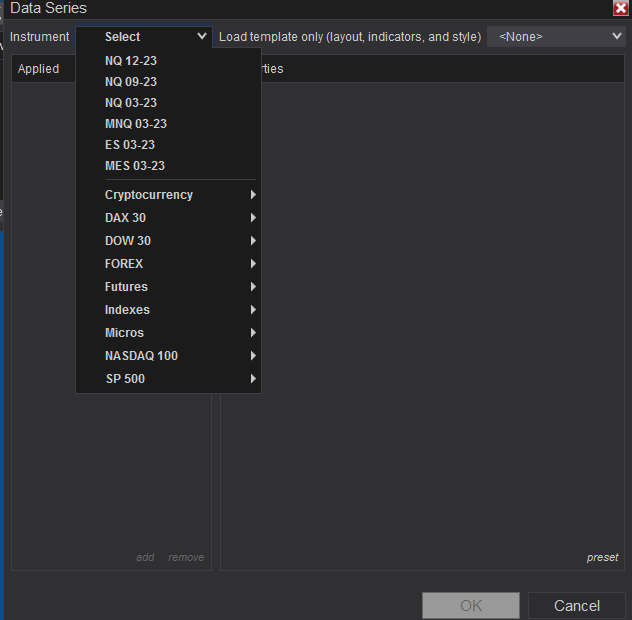
Then you will have to choose your timeframe. The timeframe is not important for this indicator, it will decorate your opened positions only, no matter the timeframe.
Then you can right click on your chart, choose “Indicators“, expand the “TradingRevealed” folder and double click on the “Trading-revealed.com.TRPositionDetails” indicator to add it to the current chart indicators:
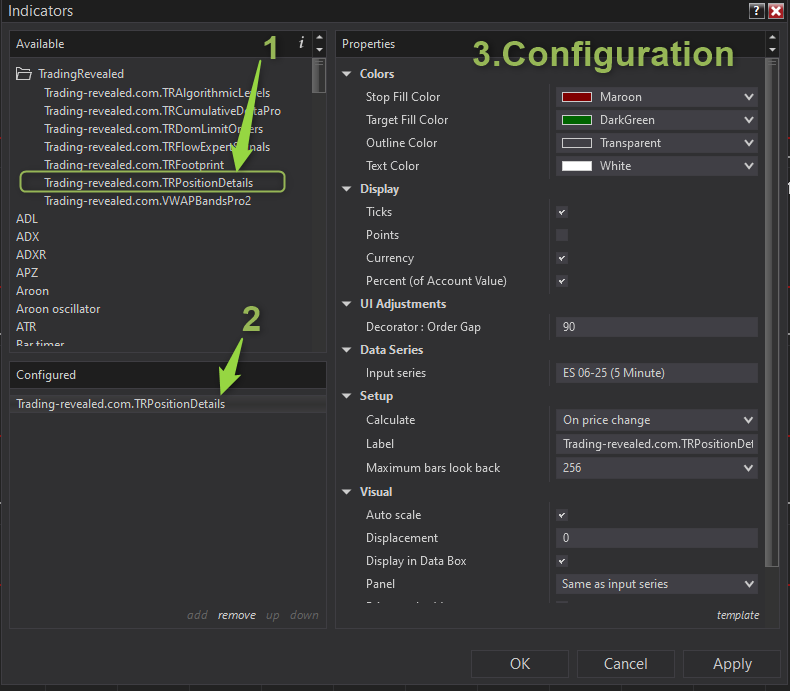
Then click on the indicator’s name from the “configured” (2.) section to display the settings on the right.
🔧 Input Parameters
📊 Display Options
| Parameter Name | Type | Default | Description |
|---|---|---|---|
| Display Ticks | bool | false | Show real-time position profit/loss in ticks. |
| Display Points | bool | false | Display PnL in points. Suitable for index futures or other point-based products. |
| Display Currency | bool | false | Show position value in monetary currency (e.g., USD, EUR). |
| Display Percent (Of Account Value) | bool | false | Shows PnL as a percentage of current account value, providing a portfolio-relative view. |
💡 Tip: You can enable multiple display formats simultaneously for cross-reference (e.g., ticks + currency).
🎨 UI Adjustments
| Parameter Name | Type | Default | Description |
|---|---|---|---|
| Decorator: Order Gap | int | Custom | Adjusts the spacing between the PnL decorator and the chart order element. Useful for visual clarity or when overlapping UI elements occur. |
🎨 Color Customization
| Parameter Name | Type | Default | Description |
|---|---|---|---|
| Stop Fill Color | Brush | e.g., Red | Fill color for Stop order zones or labels. |
| Target Fill Color | Brush | e.g., LimeGreen | Fill color for Target order zones or labels. |
| Outline Color | Brush | e.g., Gray | Color used for outlining the position or order UI elements. |
| Text Color | Brush | e.g., White | Color of all position-related text annotations. Ensures legibility across different chart backgrounds. |
🖼️ Visual Output
- Displays real-time position metrics near order markers on the chart.
- PnL can be shown in up to four formats simultaneously.
- Order and position lines use customizable colors for stop/target fill and outlines.
- Flexible spacing allows the label to avoid overlapping other chart elements.
🧠 Usage Tips
- Combine this indicator with TRFootprint and others orderflow indicators for a fully visual, multi-layered trading system.
- Use
DisplayPercentOfAccountwhen tracking position sizing and exposure across multiple instruments. - Set
FlexGapWidthaccording to your monitor resolution and chart layout to prevent UI clutter. - Align your
TextBrushwith the chart’s background theme for maximum readability.
This documentation will be updated along the way.
Feel free to ask your question or send your suggestion by email or by commenting this post.

Leave a Reply