
TRAlgorithmicLevels is a NinjaTrader indicator designed to automatically plot high-probability price levels based on algorithmic logic, including pivot points, historical levels, and psychological round numbers. It offers full customization for visual preferences and level types.
1. License prerequisites
If you didn’t send it yet, please send us your Ninjatrader’s unique machine identifier using the form we sent in the “purchase receipt” email.
You can find your machine ID by opening your Ninjatrader software and going in the Help > About menu. Then copy / paste your machine ID in the form.
It is mandatory for us to enable your lifetime license in the licensing system.
Without doing this, your indicator will stop working after 3 days, and you will get a license warning message.
2. Indicator installation
Please refer to 1. Basic Ninjatrader indicator install page.
3. Add the indicator to a chart
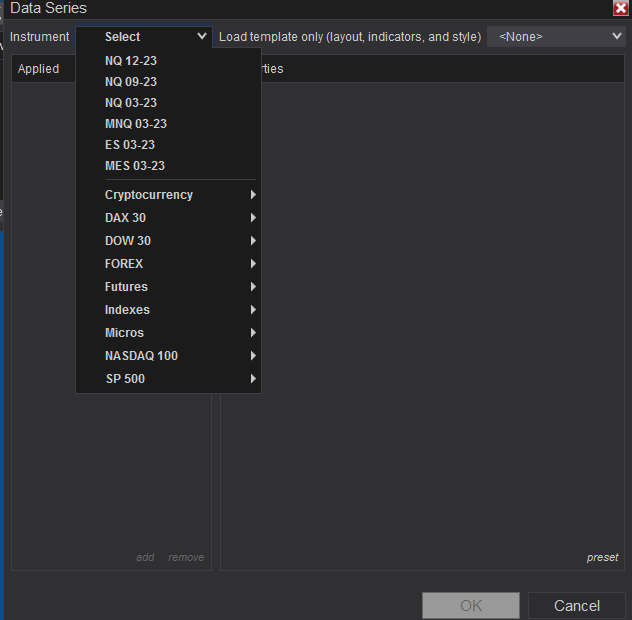
Open a chart using the New > Chart menu from Ninjatrader. Then select your instrument in the Instrument list:
Then you will have to choose your timeframe.
It works bets on intraday timeframes, you can use it on higher timeframes like daily or weekly but then you will have to remove some line that would have no sense there, like Low daily open/high/low lines.
Then you can right click on your chart, choose “Indicators“, expand the “TradingRevealed” folder and double click on the “Trading-revealed.com.TRAlgorithmicLevels” indicator to add it to the current chart indicators:
Then click on the indicator’s name from the “configured” (2.) section to display the settings on the right.
Input Parameters
| Parameter Name | Type | Default Value | Description |
|---|---|---|---|
| Show weekly pivots lines | bool | true | Displays standard weekly pivot levels (P, R1/R2/R3, S1/S2/S3). |
| Show monthly pivots lines | bool | true | Displays monthly pivot levels for broader trend reference. |
| Show open levels | bool | true | Plots previous session’s open and close levels. |
| Show previous day high & low | bool | true | Draws horizontal lines at the previous day’s high and low. |
| Show previous week high & low | bool | true | Highlights the previous week’s high and low levels. |
| Show previous month high & low | bool | true | Highlights previous month’s high and low. Useful for swing traders. |
| Show round number levels | bool | true | Displays round number psychological levels (e.g., 100, 150, 200). |
| Set a round number level Every X Points | int | 50 | Determines how frequently round numbers are plotted. For example, every 50 points. |
| Plot Label font | SimpleFont | Arial, 11pt | Defines the font family and size used for all level labels. |
| Text length | int | 80 | Length (in pixels) of the label line extending from each level. |
| Text margin color | Brush | DodgerBlue | Color used for text color. |
| Margin color Opacity | int (0–100) | 10 | Opacity of plotted lines and margins. 100 = fully opaque. |
| Left edge offset | int | 4 | Label offset in pixels or points (distance from level line). Prevents overlap. |
| Right side margin | int | 100 | Margin applied from the right side |
Visual Output
- Horizontal lines are drawn across the chart to denote key price levels.
- Each level type (pivot, open/close, high/low, round numbers) has a distinct visual layer.
Usage Tips
- Use weekly and monthly pivots for swing trading; combine with daily highs/lows for intraday levels.
- Adjust
RoundNumberEveryXPointsbased on your instrument’s volatility (e.g., 25 for ES, 50–100 for NQ). - Combine this indicator with your other order flow tools for confluence detection.
This documentation will be updated along the way.
Feel free to ask your question or send your suggestion by email or by commenting this post.

Leave a Reply