
1. License prerequisites
If you didn’t send it yet, please send us your Ninjatrader’s unique machine identifier using the form we sent in the “purchase receipt” email.
You can find your machine ID by opening your Ninjatrader software and going in the Help > About menu. Then copy / paste your machine ID in the form.
It is mandatory for us to enable your lifetime license in the licensing system.
Without doing this, your indicator will stop working after 3 days, and you will get a license warning message.
2. Indicator installation
Please refer to 1. Basic Ninjatrader indicator install page.
3. Add the indicator to a chart
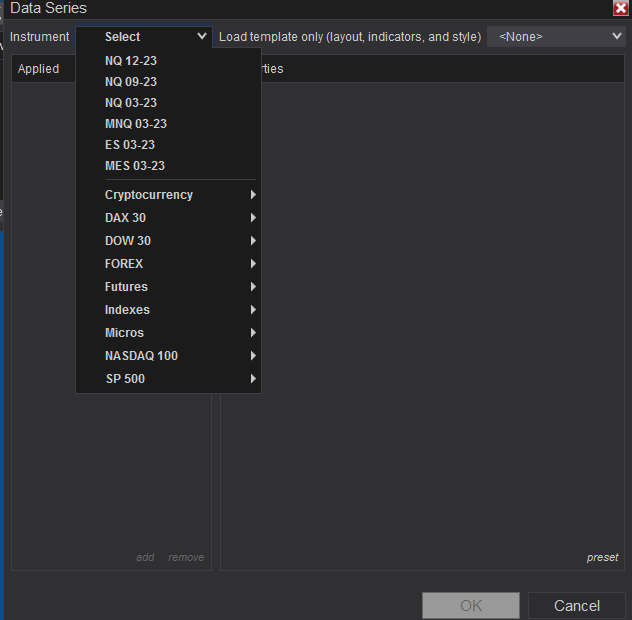
Open a chart using the New > Chart menu from Ninjatrader. Then select your instrument in the Instrument list:
Then you will have to choose your timeframe and open a footprint chart using the TRFootprint indicator (see the documentation) or Ninjatrader orderflow’s volumetric candle before adding TRFlowExpertSignals to the same chart.
If you don’t do that, you will get an error message from TRFlowExpertSignals because that data used to calculate the signals must come from a footprint chart.
Then you can right click on your chart, choose “Indicators“, expand the “TradingRevealed” folder and double click on the “Trading-revealed.com.TRFlowExpertSignals” indicator to add it to the current chart indicators:
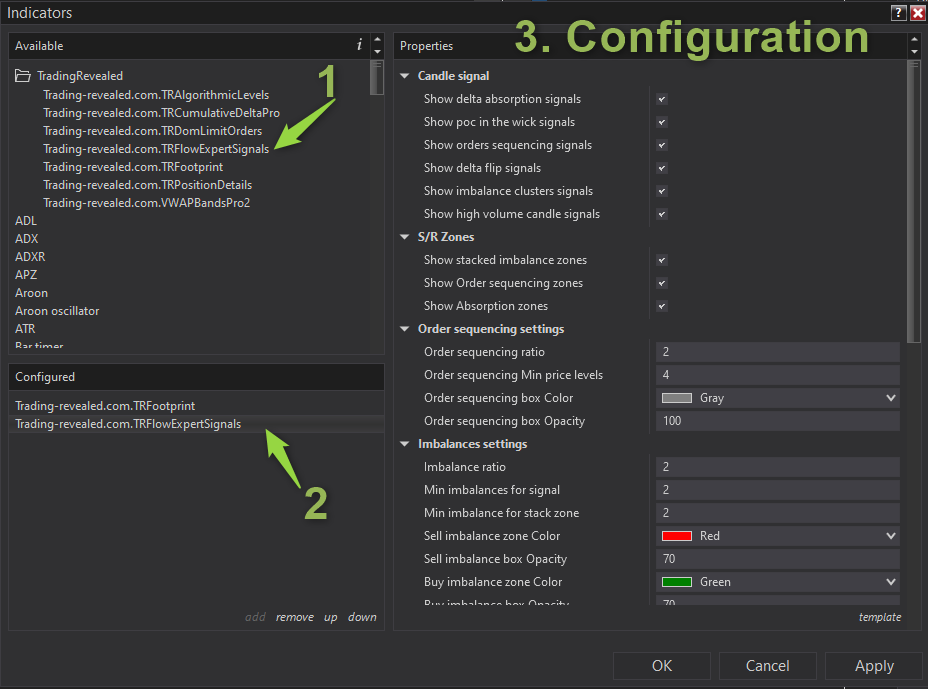
Then click on the indicator’s name from the “configured” (2.) section to display the settings on the right.
If you want to tweak the parameters, please see the input parameters in the following chapter.
📘 FlowExpertSignals Indicator – Configuration Reference
📌 Candle Signal Settings
See more about the candle signals names on chart in the TRFlowExpertSignals Cheatsheet
| Setting | Description |
|---|---|
| Show Delta Absorption Signal (Abs and Abs+) | Enables detection of absorption (telling you there are trapped traders) in the candle.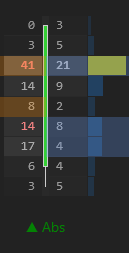 Abs+ signal means the signal is bigger than the average other recent absorption signals. |
| Show POC in the Wick Signal | Flags candles where Point of Control lies in the wick (high volume rejected).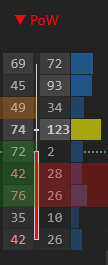 |
| Show Orders Sequencing Signal | Detects sequential aggressive orders (e.g., buy→ 2*buy volume at next price→ 4*buy volume at next price).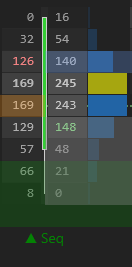 |
| Show Delta Flip | Highlights candles with a sudden flip in delta direction. |
| Show Imbalance Clusters Signal | HighLights candles where we have multiple bid/ask imbalances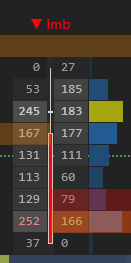 |
| Show High Volume Candle Signal | Detects high volume candles (often used to anticipate a reversal).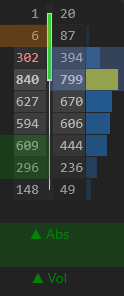 |
🧱 S/R Zones Settings
| Setting | Description |
|---|---|
| Show Stacked Imbalance Zones | Displays support/resistance zones from consecutive imbalances.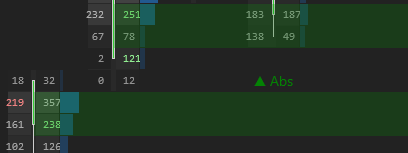 |
| Show Orders Sequencing Zones | Shows zones formed by order sequencing. This can sometimes coincide with areas of imbalance but not always. |
| Show Absorption Zones | Highlights trapped trader zones (absorption). For instance, this means we had aggressive sellers at a price level but price went straight up. They are trapped and it will be a future support level.  |
🔁 Order Sequencing Settings
| Setting | Description |
|---|---|
| Order Sequencing Ratio (default: 2) | Minimum volume ratio between sequential levels. |
| Order Sequencing Min Price Levels (default: 4) | Minimum number of levels to validate a sequence. |
| Box Color (default: Gray) | Color used to draw sequencing boxes. |
| Box Opacity (default: 100) | Transparency level of sequence zone boxes (0–255). |
⚖️ Imbalances Settings
| Setting | Description |
|---|---|
| Imbalance Ratio (default: 2) | Minimum ask/bid diagonal ratio to flag an imbalance. |
| Min Imbalances for Signal (default: 2) | Minimum non-consecutive imbalances in a candle to trigger a candle signal. |
| Min Imbalances for Stack Zone (default: 2) | Minimum consecutive imbalances to draw an imbalance zone. |
| Sell Zone Color / Opacity | Visual settings for sell imbalance zones. |
| Buy Zone Color / Opacity | Visual settings for buy imbalance zones. |
🔸 Absorption Zone Settings
| Setting | Description |
|---|---|
| Sell Absorption Zone Color / Opacity | Visual settings for bearish absorption zone. |
| Buy Absorption Zone Color / Opacity | Visual settings for bullish absorption zone. |
🖋 Display Settings
| Setting | Description |
|---|---|
| Font Size for Candle Signals (default: 14) | Text size for signal labels below/above candles. |
⚙️ Performance Settings
| Setting | Description |
|---|---|
| Draw Zones on Last X Bars | Limits how far back zones are drawn to keep the best possible chart performance/speed. |
✅ Notes
- Opacity values range from
0(invisible) to255(fully opaque). - Diagonal imbalance logic aligns with footprint-style analysis.
- Fell free to adjust the settings for your instruments to get a relevant number of signals/zones. The default settings have been tested on ES instrument but will not suit well for every instrument.
This documentation will be updated along the way.
Feel free to ask your question or send your suggestion by email or by commenting this post.

Poster un Commentaire