
TRDomLimitOrders is a custom NinjaTrader indicator designed to enhance the display and analysis of limit orders within the DOM (Depth of Market). It provides real-time visualization of buy/sell pressure through customizable histogram plots and color schemes.
Warning: this indicator requires Level 2 data from your futures data provider.
1. License prerequisites
If you didn’t send it yet, please send us your Ninjatrader’s unique machine identifier using the form we sent in the “purchase receipt” email.
You can find your machine ID by opening your Ninjatrader software and going in the Help > About menu. Then copy / paste your machine ID in the form.
It is mandatory for us to enable your lifetime license in the licensing system.
Without doing this, your indicator will stop working after 3 days, and you will get a license warning message.
2. Indicator installation
Please refer to 1. Basic Ninjatrader indicator install page.
3. Add the indicator to a chart
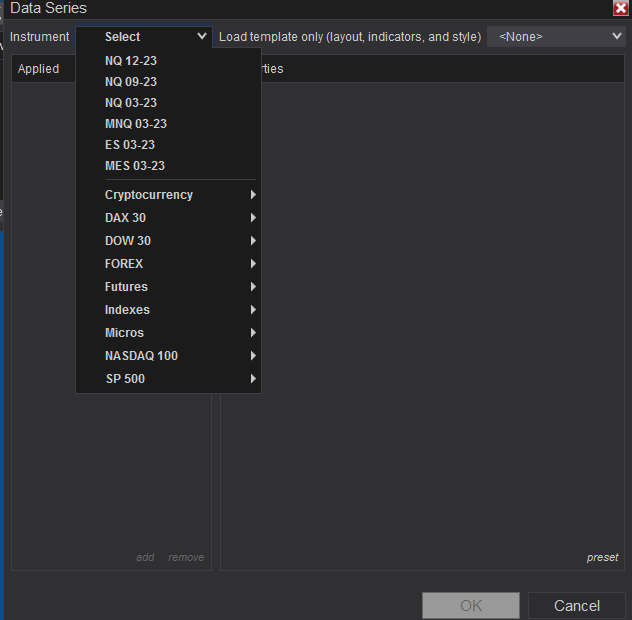
Open a chart using the New > Chart menu from Ninjatrader. Then select your instrument in the Instrument list:
Then you will have to choose your timeframe.
The indicator will work on all timeframe but let’s say we will open a 1 minute chart from ES future contract for this example:
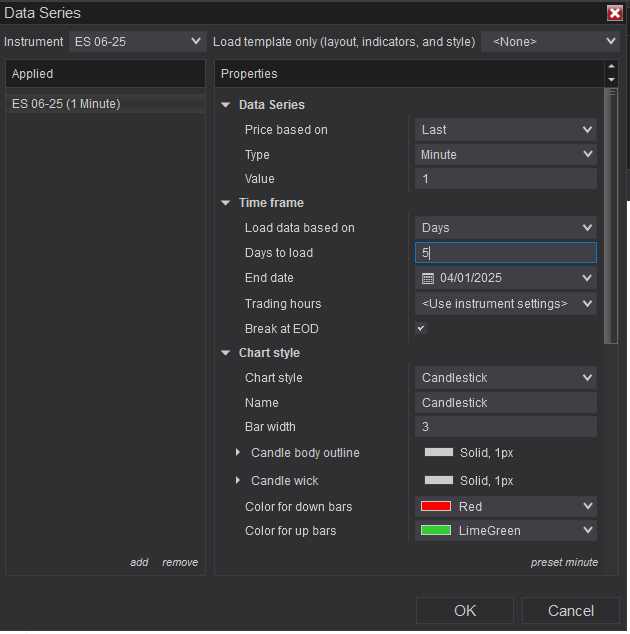
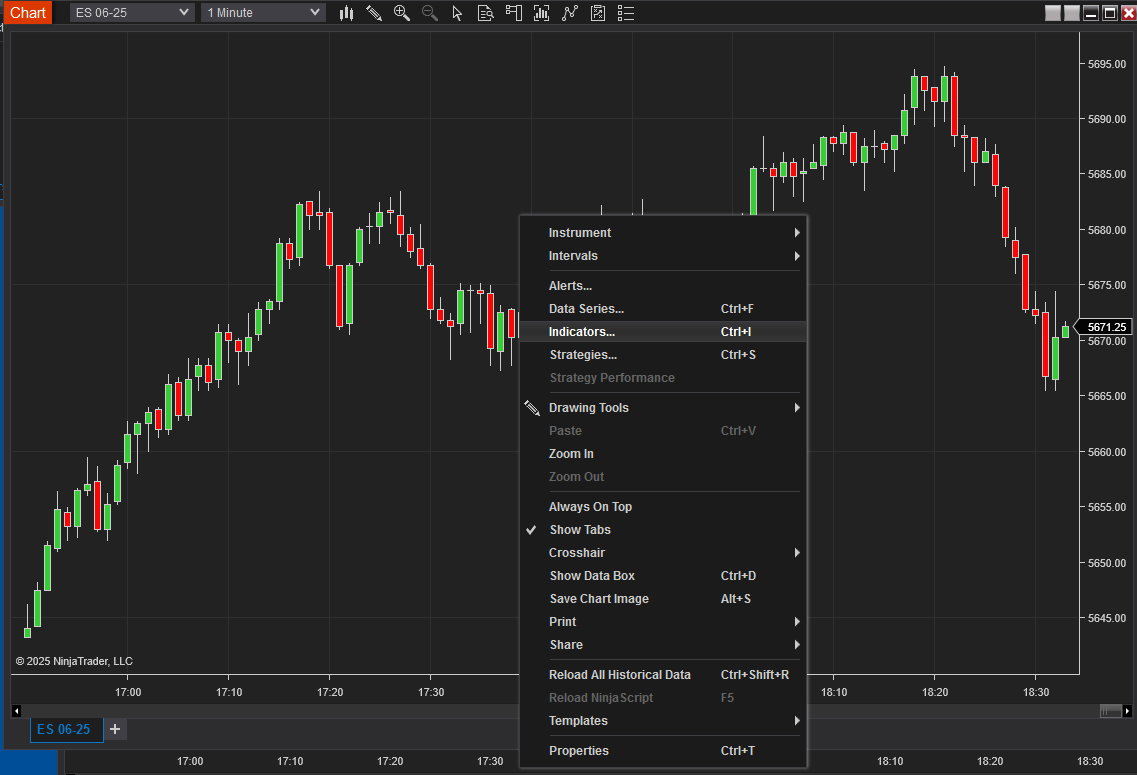
Click “OK” to open the chart and right click on your chart and choose “Indicators” :
On the top left, expand the “TradingRevealed” folder and double click on the “Trading-revealed.com.TRCumulativeDeltaPro” indicator to add it to the current chart indicators:
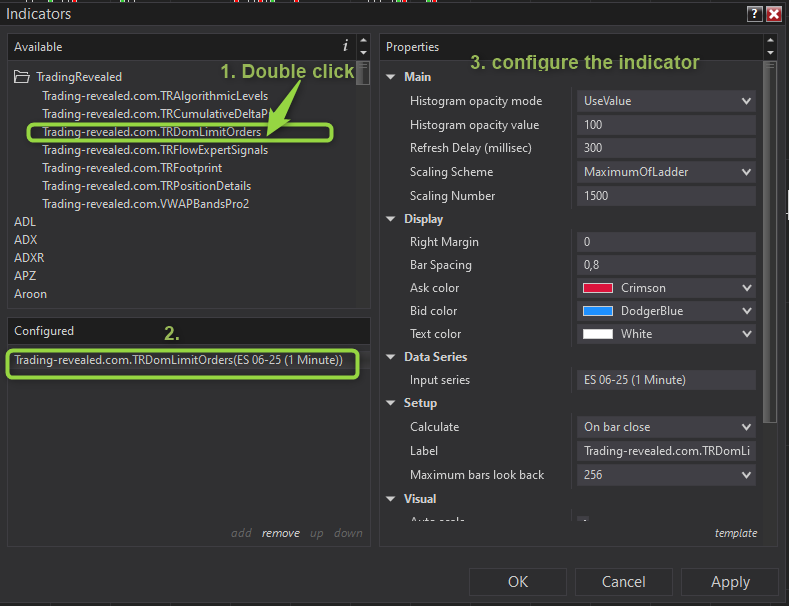
Then click on the indicator’s name from the “configured” (2.) section to display the settings on the right.
4. Input parameters full description
| Parameter Name | Type | Description |
|---|
| MarginRt | double (default: 0) | Defines an additional margin or buffer around the current price levels for DOM calculation. |
| RefreshDelay | int (default: 300) | Time delay (in milliseconds) between data refresh cycles. Lower values update more frequently. |
| HistogramOpacityMode | TRDomHistogramOpacityMode (default: UseValue) | Defines how histogram transparency is calculated. Can use a fixed value or a dynamic scale. |
| HistogramOpacityValue | int (0–100) (default: 100) | Sets histogram bar transparency. Only used if HistogramOpacityMode is set to UseValue. 100 = fully opaque. |
| ScalingNumber | int (default: 1500) | Adjusts the scaling factor for histogram size calculation. Larger values compress the visual size. |
| BarSpacing | double (default: 0.8) | Controls spacing between histogram bars. Ranges from 0 (no spacing) to 1 (full spacing). |
| AskColor | Brush (default: Crimson) | Color used to represent Ask-side (sell) limit orders in the DOM histogram. |
| BidColor | Brush (default: DodgerBlue) | Color used to represent Bid-side (buy) limit orders in the DOM histogram. |
| TextColor | Brush (default: White) | Color of any text or labels rendered by the indicator. Ensures visibility over different backgrounds. |
5. Visual Output
- Histogram bars are drawn at DOM price levels to visualize bid/ask liquidity.
- Bars are colored using
AskColorandBidColor. - Text annotations (if enabled) appear in
TextColor.
6. Usage Tips
- Use a lower
RefreshDelayfor more responsive updates during volatile market conditions. - Adjust
ScalingNumberto match your market’s depth profile. - Combine with price action or volume indicators for greater context.
- Set
HistogramOpacityValueto 50–80 for a subtle overlay, or keep at 100 for high contrast.
This documentation will be updated along the way.
Feel free to ask your question or send your suggestion by email or by commenting this post.

Poster un Commentaire