Tired of looking at a price chart that print the result of buyers vs sellers activity after the fact? Do you want to have a real edge in trading by seing what is happening in buy/sell market orders before the price moves?
Check this cumulative delta indicator!
Update from June the 26th, 2023:
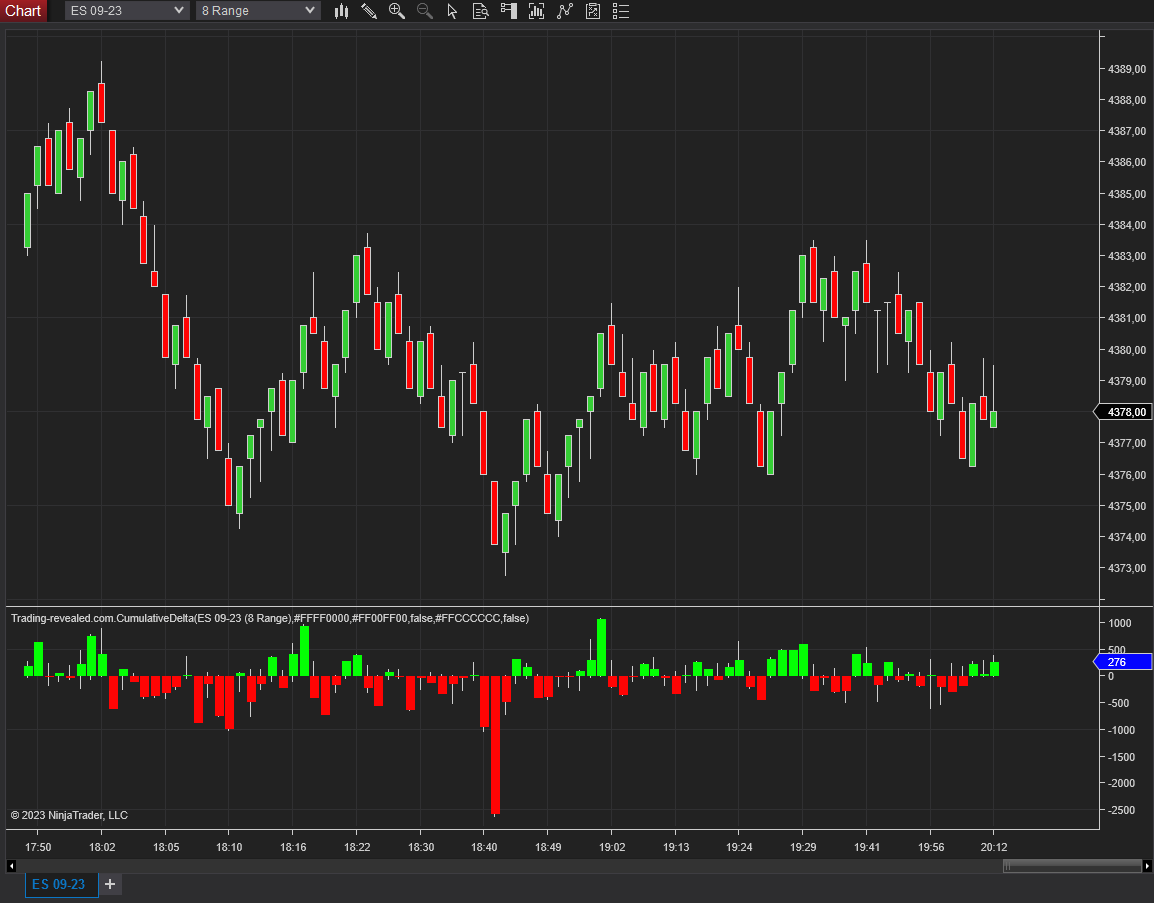
– v1.1.0 release: this new version can display a volume delta histogram relative to every candle (it’s not cumulative)

How does it work?
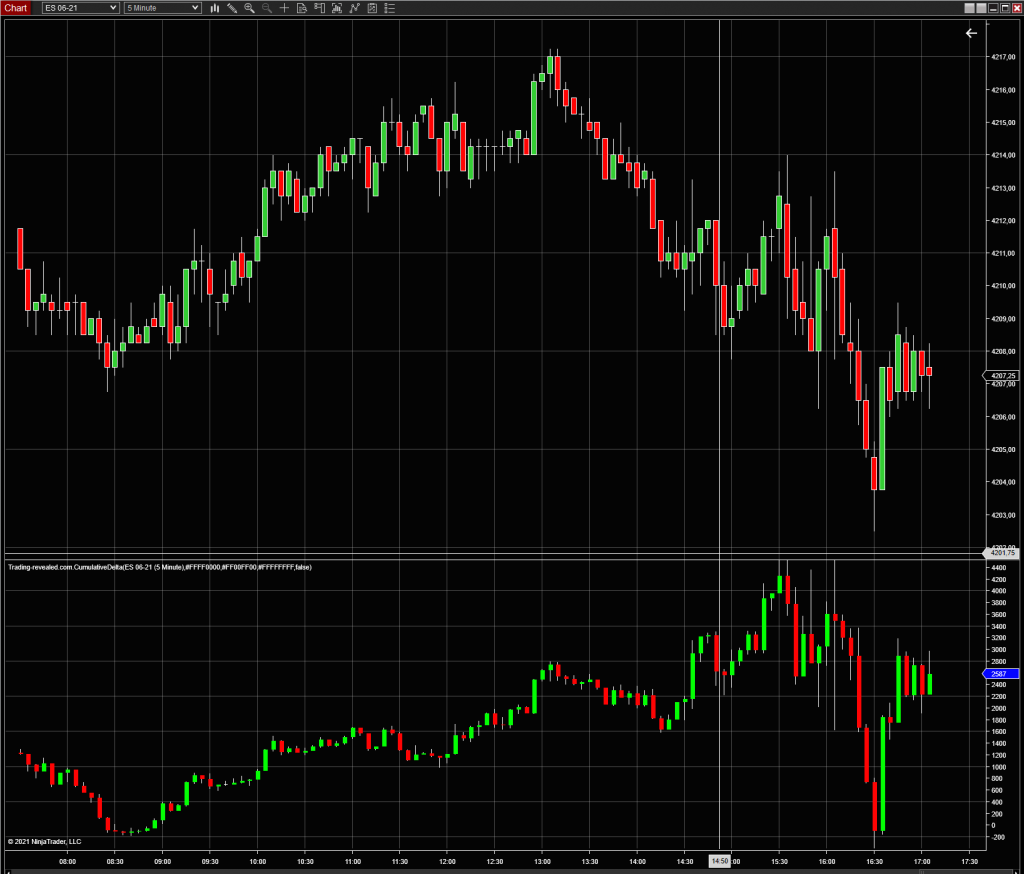
It display a candle representing the difference between buyers and sellers volume (market executed orders on the bid and ask). That’s why it’s called “volume delta“.
The indicator will reset the delta to 0 at every new day, and then all the next candles will be cumulative. It means that every new candle from the indicator will open where the previous candle closed (like a standard candle price chart). This allows us to easily analyze what the volume delta chart is doing in relation to the price chart. You can check some analysis examples here: http://www.trading-revealed.com/tag/cumulative-volume-delta/
Download link

Important install note
After the indicator importation in Ninjatrader 8, and before attaching the indicator to a chart, ensure that your chart is in Tick Replay mode. The cumulative Volume Delta needs it to calculate and sum up all the market orders coming on the bid and ask in real time. It won’t work properly without Tick Replay.
To activate this mode, right click on your chart and select “Data Series” configuration menu, and then check the “Tick Replay” box. Apply this configuration and now you can add the indicator to your chart.

Non cumulative mode
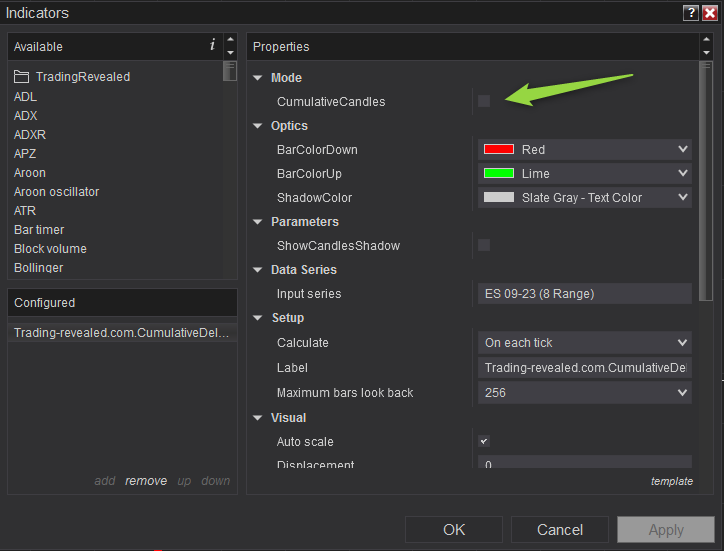
Since version 1.1.0, you can uncheck the “CumulativeCandles” option to get a candle by candle individual volume delta. This delta is not cumulative, it resets at every bar. It’s very useful to see the aggressive buyers and sellers in a candle.


hello. how to get DeltaClose?