
Was the FOMC move direction predictable on the Dow yesterday (july the 27th) ?
1. Daily chart analysis
As usual we don’t know the direction with 100% certainty but I have been long before the FOMC and held it without any stress thanks to my Daily timeframe analysis. Let’s look at it:
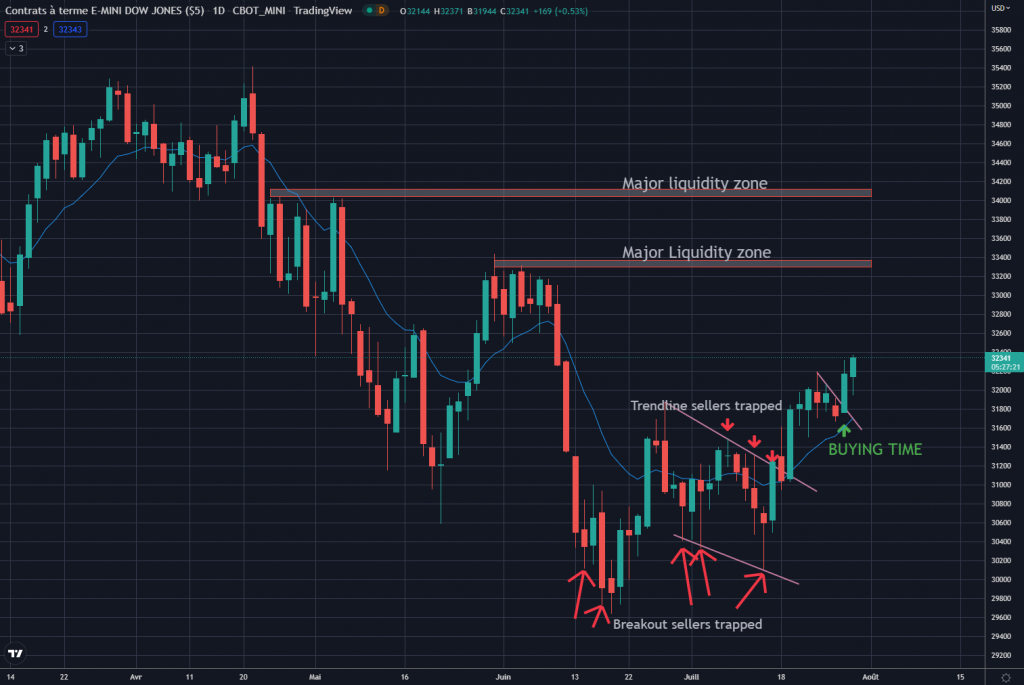
The high probability direction in my mind came from this (on a technical standpoint only) :
- lot of sellers traps at the bottom of the chart
- Major liquidity zones at the top of the chart
That’s enough to anticipate an up move on Daily.
1. Lower timeframe buy from July the 28th
Now I have added to my buy position today (July the 28th) after another sellers trap setup on lower timeframes. Look at this:
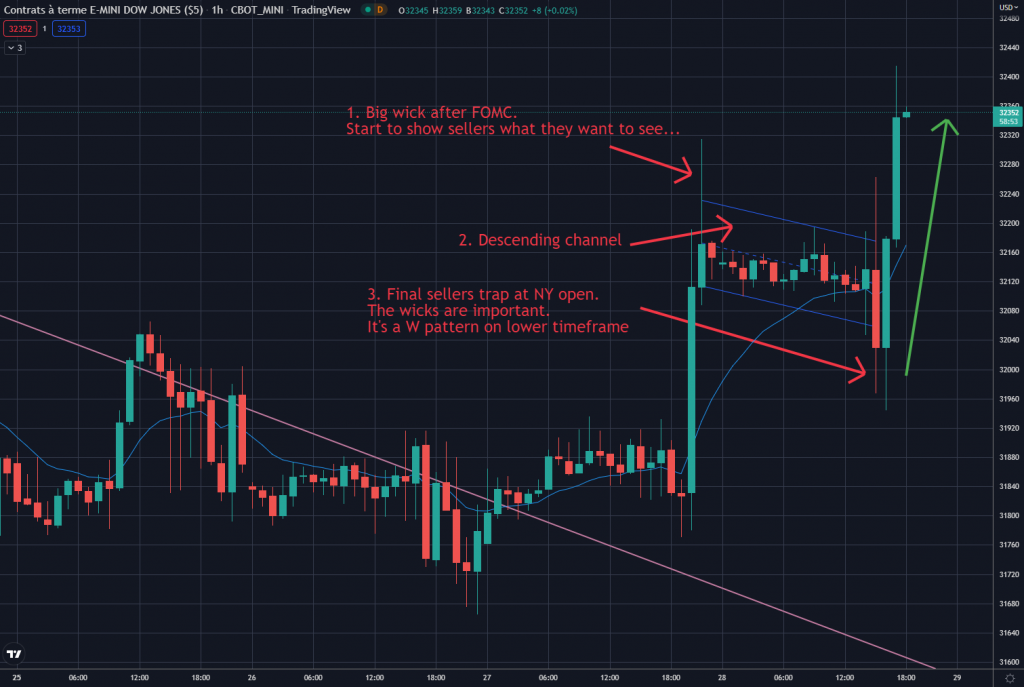
- We had a big upper wick after the FOMC up move and before the daily => this is the first signal to wake up sellers
- then we started the next day with a descending channel, which is basically a down trend for sellers
- at NY open, we had a bigger down move to induce more sellers
And then we had a clear buy pattern. We can see it better on the M15 and M5 charts:
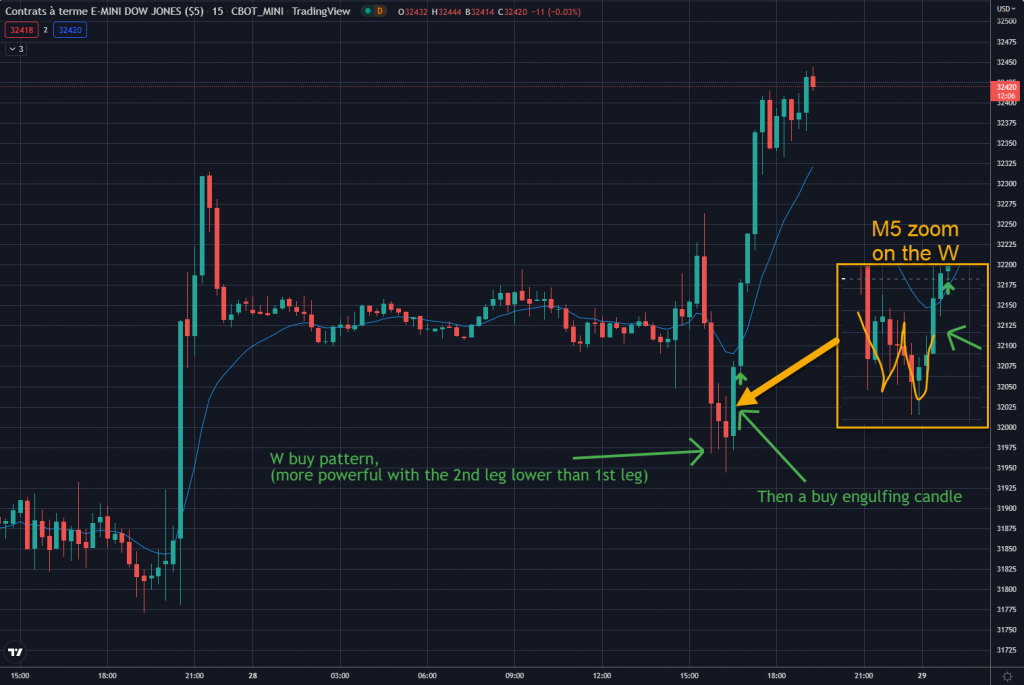
The W pattern + the green engulfing candle gave us a nice signal to add to the FOMC up move.
I’ll post some others stuff dedicated to the candle wicks, but pay close attention to the wicks in general.
Here The W second leg being lower than the first is important, it means the early buyers stops from first leg have been hit + breakout sellers from 2nd leg have been trapped.
I know this is advanced analysis but I hope you will get some value from this article.

Leave a Reply