Instrument: NZDUSD
Date: 11.29.2021
I have sold NZDUSD since november the 8th for a long term trade using market structure analysis.
Here is why.
1. Weekly chart structure analysis
When you look at the NZDUSD market structure on the weekly timeframe, you can see this:

2. Daily chart structure analysis
When you look at the NZDUSD market structure on the daily timeframe, you can see this:

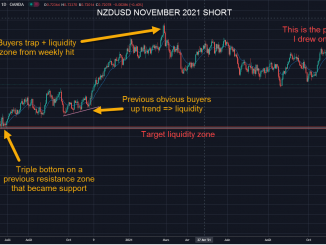
- It looks like the previous up trend is over since February. It ended nicely with a fast buyers trap move, when you look at the weekly you’ll see a pin bar hitting a liquidity zone.
- On the left, you have two obvious buying zones: a triple bottom and a small up trend. These zones are our targets because this is where the liquidity is, the big players and algorithms will target these zones.
- The buyers trap is confirmed by the recent price action since february because the price tried to retrace up several times by making higher highs waves. The main purpose of these patterns is to induce more buyers before the drop.
This is again the same story than the previous GBPNZD sell signal I sent in october.
I hope this market structure analysis is clear enough for you, if not feel free to comment.
PS : this is not a financial advice, it’s a technical analysis for educational purpose only. You are solely responsible for any position taken on the financial markets.

Leave a Reply