Date : 11.04.2021
Instrument : Dax CFD
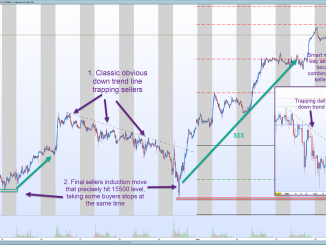
I will come back on an interesting DAX sellers trap setup from october the 29th that actually combines a sellers trap from low timeframes (you could see it on M15 for example) with a bigger timeframe sellers trap that you could see on the Daily timeframe.
1. The M15 (4 days) sellers trap
If you follow what I teach, you will recognize the same sellers trap pattern as usual:
- A pretty clean and obvious down trend line from october the 26th to october the 29th (point 1 in the screenshot below)
- A bigger shift selling shift from the trend line to induce more sellers (point 2) on october the 29th. This aggressive move has another role at the same time: taking the liquidity from older buyers. Note the precision: this move hit the 15500 key level perfectly.

From this 15500 level, this was the start of the real smart money move, the move that you want to take to follow the smart money and make the biggest and instant profits.
Why?
2. Market actors psychology
You have several levels of traders there:
- The best sellers followed a trendline during 4 days to make a small amount of profit with a lot of stress if they were smart enough to trail their stop properly or set a take profit order above 15500 level
- The average sellers that saw this down trend and put a stop loss order above a trendline touch point because he’s managing his risk properly. When most of these sellers saw the down trend, it was too late and their stop loss orders have been hit
- The classic beginners who saw the trend line at the end too, they entered with no stop loss orders + they prayed every day for a come back down. I don’t need to say that their trading accounts are gone.
- And you have the experimented trader who understand the market structure and what the smart money is doing. I want you to be this one. This trader could be a bit aggressive and could entered very low at the 15500 rejection, put its stop loss oder at breakeven quickly and enjoy the profits with no stress at all. Or maybe this trader wanted to get a entry confirmation and waited for the down trend line break with a candle close above the trendline. In both case, he is in instant profit with an outstanding risk:reward ratio because he can have a very small stop loss.
3. The daily sellers trap
Usually when you enter this trend line trap setups, the easy target is around the start of the trend line. On this setup, the easy target was actually the start of the trend line at 15780 because the trend line starts with a double top, it’s an obvious for sellers to put their stop loss orders.
But this buy trade went much higher than that, and I think it’s interesting to understand why: The M15 trap was a signal trap in a bigger sellers trap on the Daily timeframe. What was the target from this daily sellers trap? 16000. Much more interesting than the first M15 target, isn’t it? Let’s look at the daily chart:

Note that the M15 trend line trap coincide with an horizontal support/resistance trap on the Daily. This is a massive sellers induction.
I hope you will learn something from this. Let me know in the comment section if you have any question.
Happy trading!

Leave a Reply