Date: August the 24th 2023
Instrument: ES futures (S&P500)
Not only the drop from today was not surprising to me but it was quite easy to spot an entry using the VWAP bands indicator views in different timeframe.
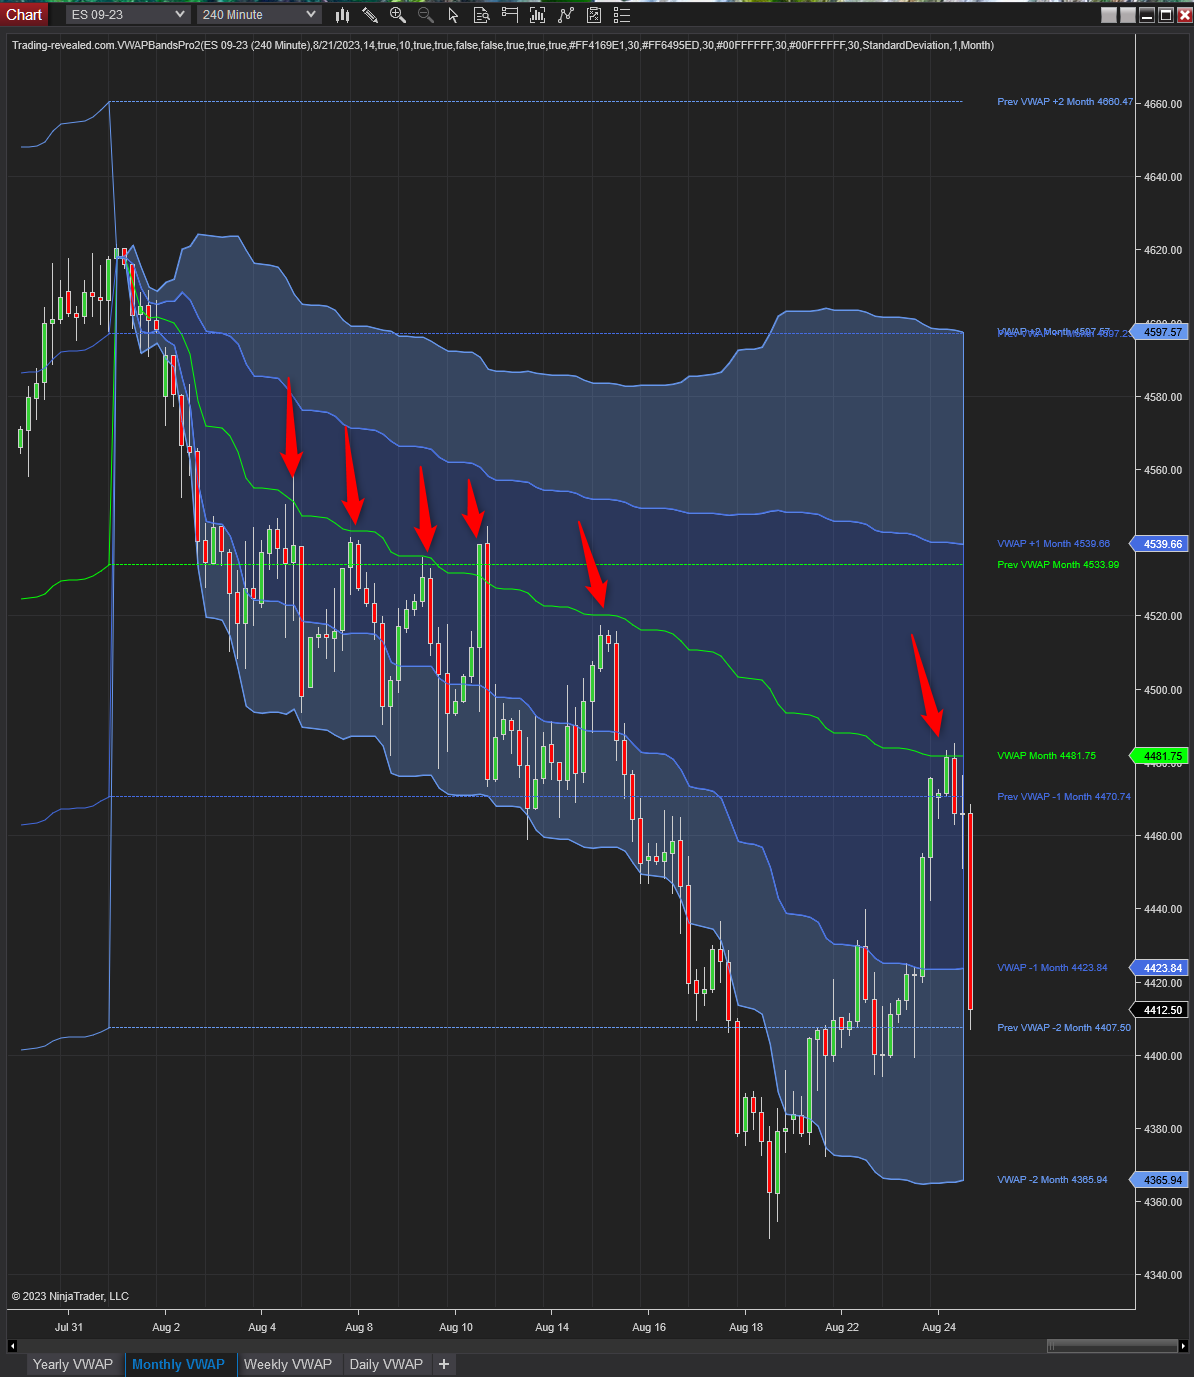
Let’s look at the monthly vwap first: during the whole August month price bounced at VWAP line and then stayed below. Today it did the same, we could have a very precise entry with these chart alone.

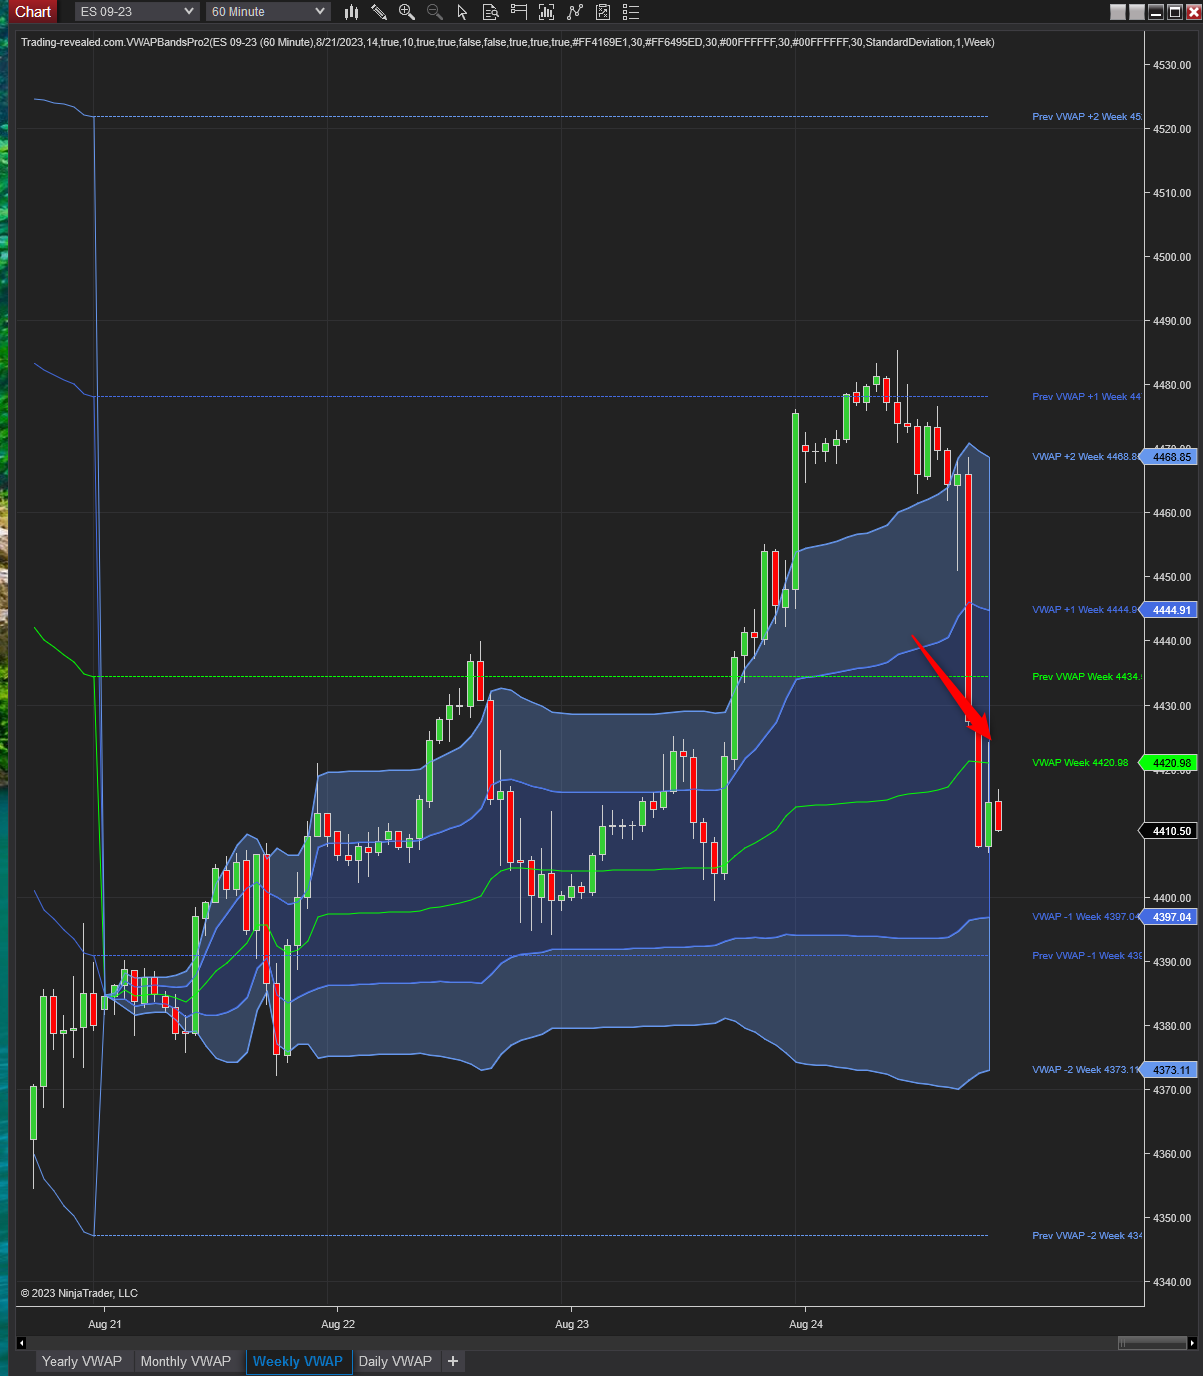
Let’s look at the Weekly vwap now: price retraced from below the weekly vwap and bounced at it, same story:

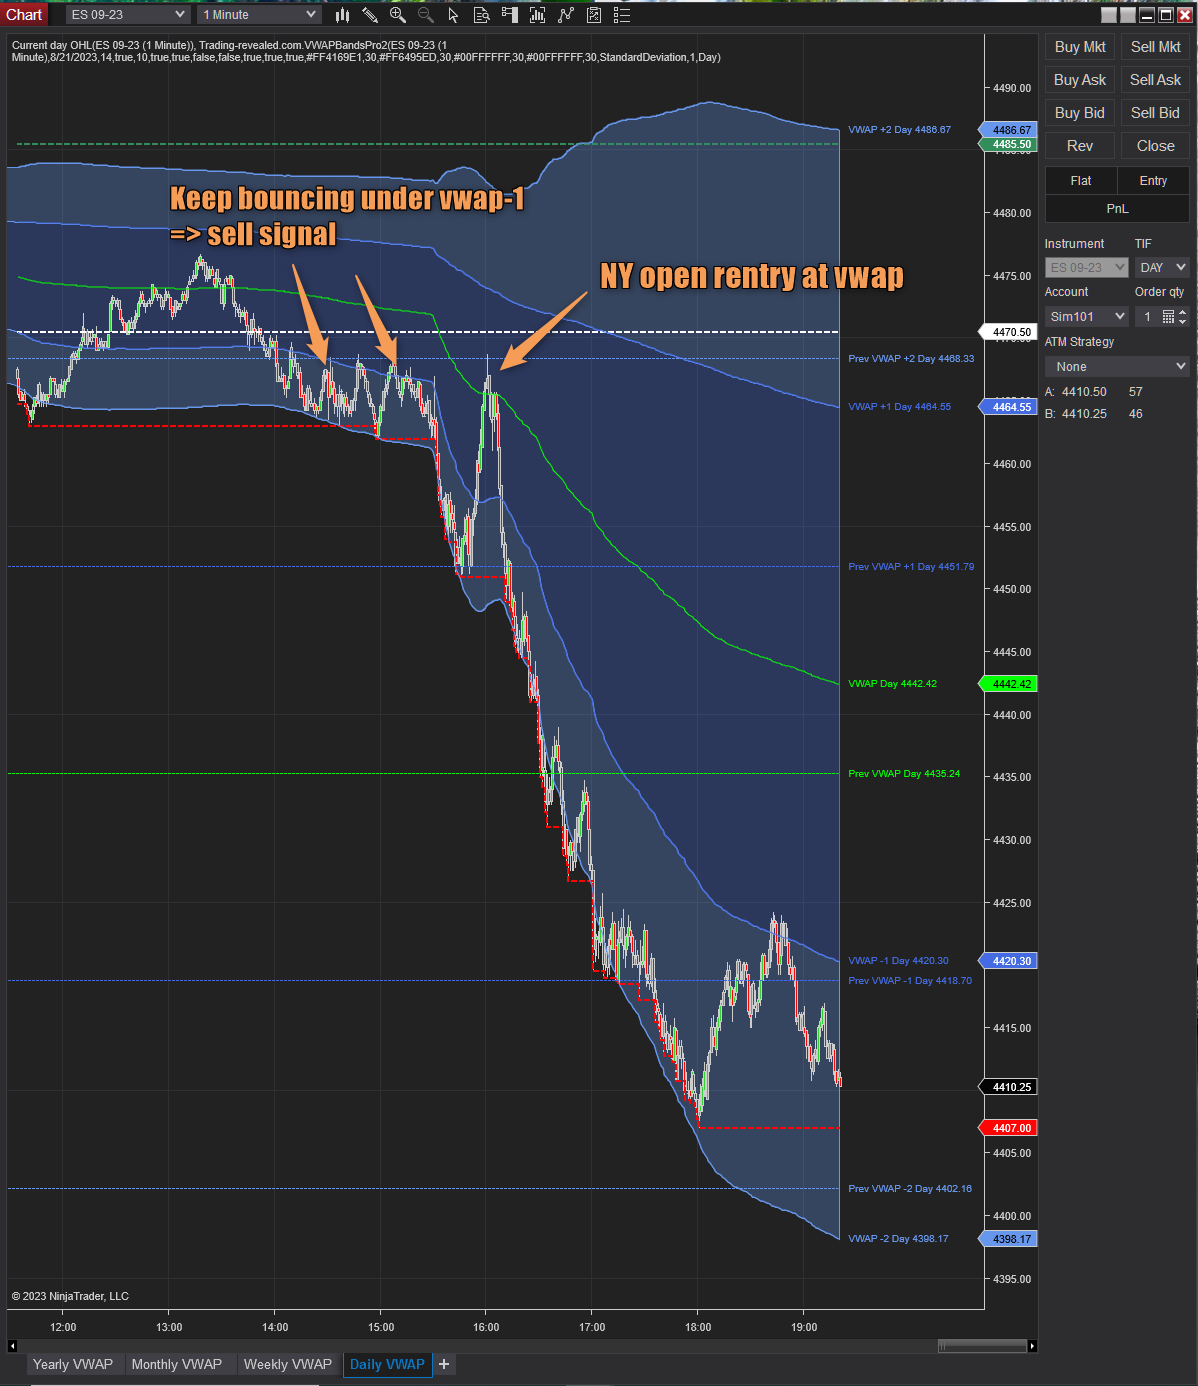
Let’s continue to go into lower timeframes and look at the current day’s vwap.
Before new york open, price was in downtrend and bounced several at VWAP-1: this is a strong sell signal.
The price gave us a reentry after NY open by retracing to the same zone that was corresponding to vwap line at this time:

Then the price stayed in down trend below vwap-1, that was an easy trade that could have been trailed with a trailing stop.
More about this vwap bands indicator at VWAP Bands Pro indicator 2.0 for Ninjatrader

Poster un Commentaire