
1. License prerequisites
If you didn’t send it yet, please send us your Ninjatrader’s unique machine identifier using the form we sent in the “purchase receipt” email.
You can find your machine ID by opening your Ninjatrader software and going in the Help > About menu. Then copy / paste your machine ID in the form.
It is mandatory for us to enable your lifetime license in the licensing system.
Without doing this, your indicator will stop working after 3 days, and you will get a license warning message.
2. Indicator installation
- Download the indicator zip file from your “purchase receipt” email
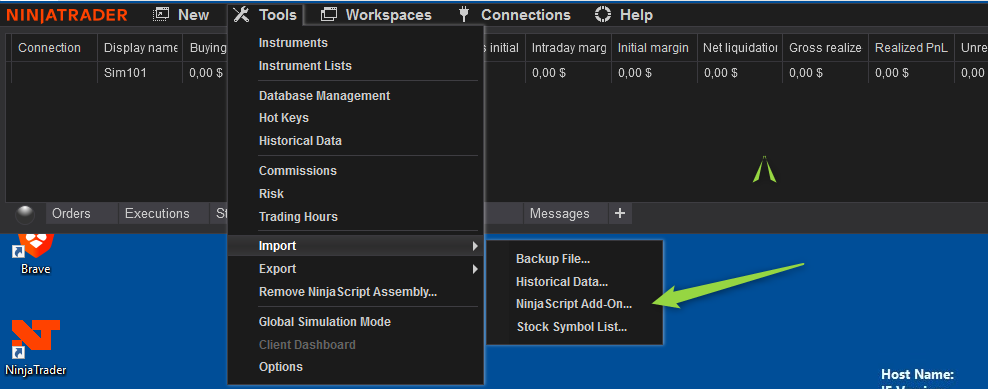
- Open your Ninjatrader software and click on the Tools > Import > Ninjascript Add-on menu:
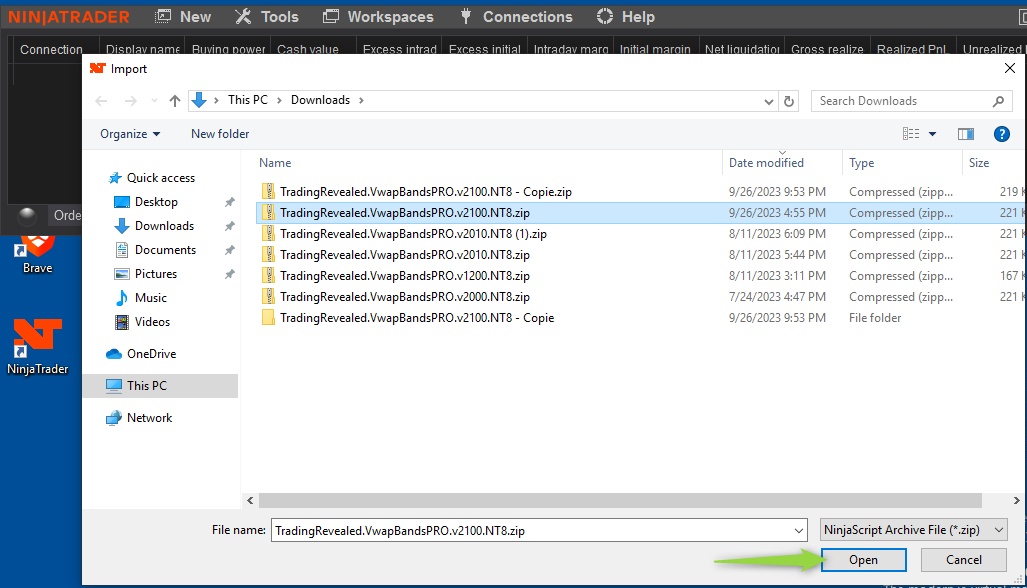
Then select the indicator zip file you got from the download link in the “purchase receipt” email:
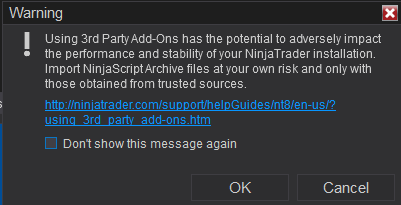
Click “OK” on the 3rd party add-ons warning:
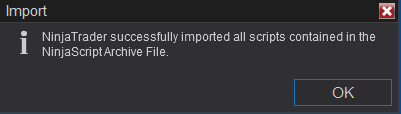
And you should get the installation success confirmation message below:
Then close and reopen your Ninjatrader software for the changes to be applied.
3. Add the indicator to a chart
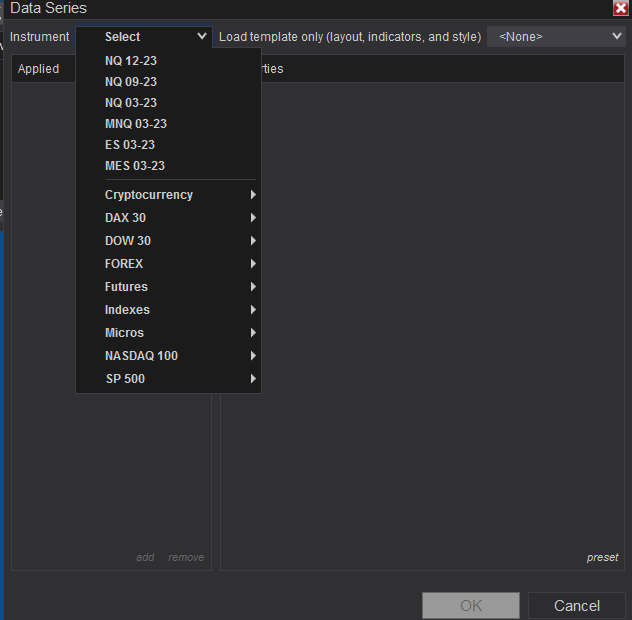
Open a chart using the New > Chart menu from Ninjatrader. Then select your instrument in the Instrument list:
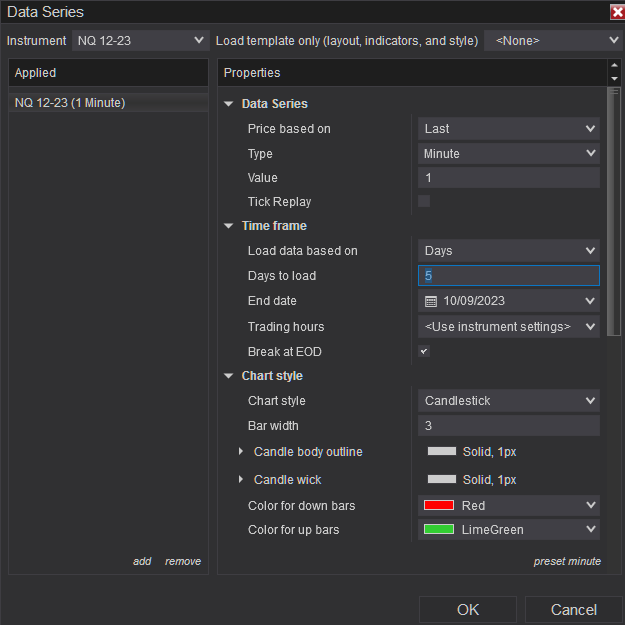
Then you will have to choose your timeframe.
When using the VWAP bands indicator, some timeframes are making more sense. You need to have more candles than the VWAP calculation period. For instance, having weekly candles with a daily VWAP means that you may wait 1 week to see a minor vwap move from an intraday session, it doesn’t make sense.
Here is my configuration advice:
- Daily candles with Yearly VWAP
- 240 Min (H4) candles with Monthly VWAP
- 60 Min candles with Weekly VWAP
- 1 Min or 5 min candles with Daily (current session) VWAP
Let’s say we will open a 1 min chart with 5 days of history (for a daily vwap) for this example:
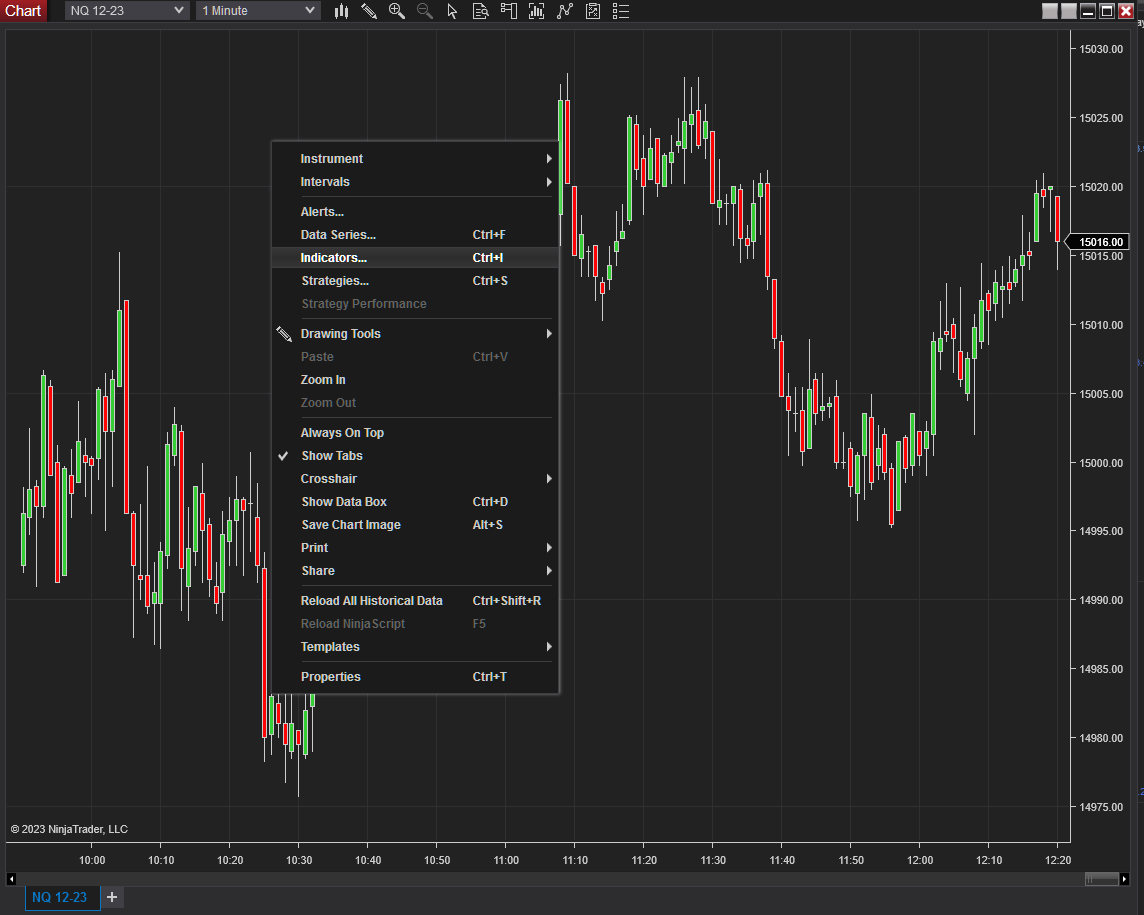
Click “OK” to open the chart and right click on your chart and choose “Indicators” :
On the top left, expand the “TradingRevealed” folder and double click on the “Trading-revealed.com.VWAPBandsPro2” indicator to add it to the current chart indicators:
Then click on the indicator’s name from the “configured” section to display the settings on the right.
4. Input parameters full description
| Main Parameters | |
| VWAP Interval (starting point) | It defines your vwap period. The vwap calculation will reset at every new period. You can use all these periods: – Day – Week – Month – Year – Quarter – Anchored : this is a special one where you can configure a starting time yourself. |
| Extend previous period lines | If checked, this will extend the previous period vwap and bands lines. Let’s say you have a daily vwap, you will easily see important levels from the previous day. |
| Display vwap band 1 | If checked, this will display the 1st vwap band around the VWAP line (what we call the vwap -1 and vwap +1) |
| Vwap band 1 area color | The background color from vwap line to vwap+1 and vwap-1 lines |
| Vwap band 1 area opacity | The background color opacity from vwap line to vwap+1 and vwap-1 lines |
| Color bands area for curent period only | if checked, you will have the bands area colored for the most recent period only (ie current day for a daily vwap, current week for a weekly vwap and so on). If unchecked, the bands area will be colored for the whole chart. |
| Labels Parameters | vwap bands names and price labels config |
| Show current vwap lines labels | If checked, it will show every line labels at the right of your chart |
| Show previous vwap lines labels | If checked, it will show the lines labels for the previous period too |
| Show price values in labels | Price values in labels can be disabled as you may find it redundant with the price displayed on the Y axis from your chart |
| Lines labels font size | You can increase or decrease the labels font size |
| Pro Parameters | These are advanced parameters, default config works just fine for most users |
| Bands calculation mode | – StandardDeviation : this is the default mode using a standard deviation formula that we know is the most used one by the algoritms – Points : your vwap band step will be a static number of price points that you define in the bands calculcation multiplier field. For instance, if you set 10 for a Nasdaq chart and the vwap is at 15000, you will get vwap band -1 at 14990, vwap band +1 at 15010, vwap band +2 at 15020 etc. – AverageTrueRange : it will use an ATR calculation. Selecting this mode will display another input field named “ATR Period”, it is the average true range period that will be used for the calculation – VwapPricePercentage : your vwap band step will be calculated using a current instrument’s price percentage. For instance, if your vwap is at 15000 and you set 10 as the bands calculation multiplier, you vwap band +1 will be at 15015 |
| Bands calculation multiplier | The bands calculation multiplier, ie the number of std deviation, points, ATR, and price percent you want. |
This documentation will be updated along the way.
Feel free to ask your question or send your suggestion by email or by commenting this post.

Hello,
Nice indicator but sorry I bought it for VwapPricePercentage parameter and I cannot find it…
Hello Jean,
To select the VwapPricePercentage mode, please go into the VWAPBandsPro2 indicator settings, scroll down a bit if needed and you will have the “Pro Parameters” block. You have 2 configuration line there:
Change the “Bands calculation Mode” to “VwapPricePercentage” and you can play with the “Bands calculation multiplier”: 1 unit represents the vwap price value * 0.0001