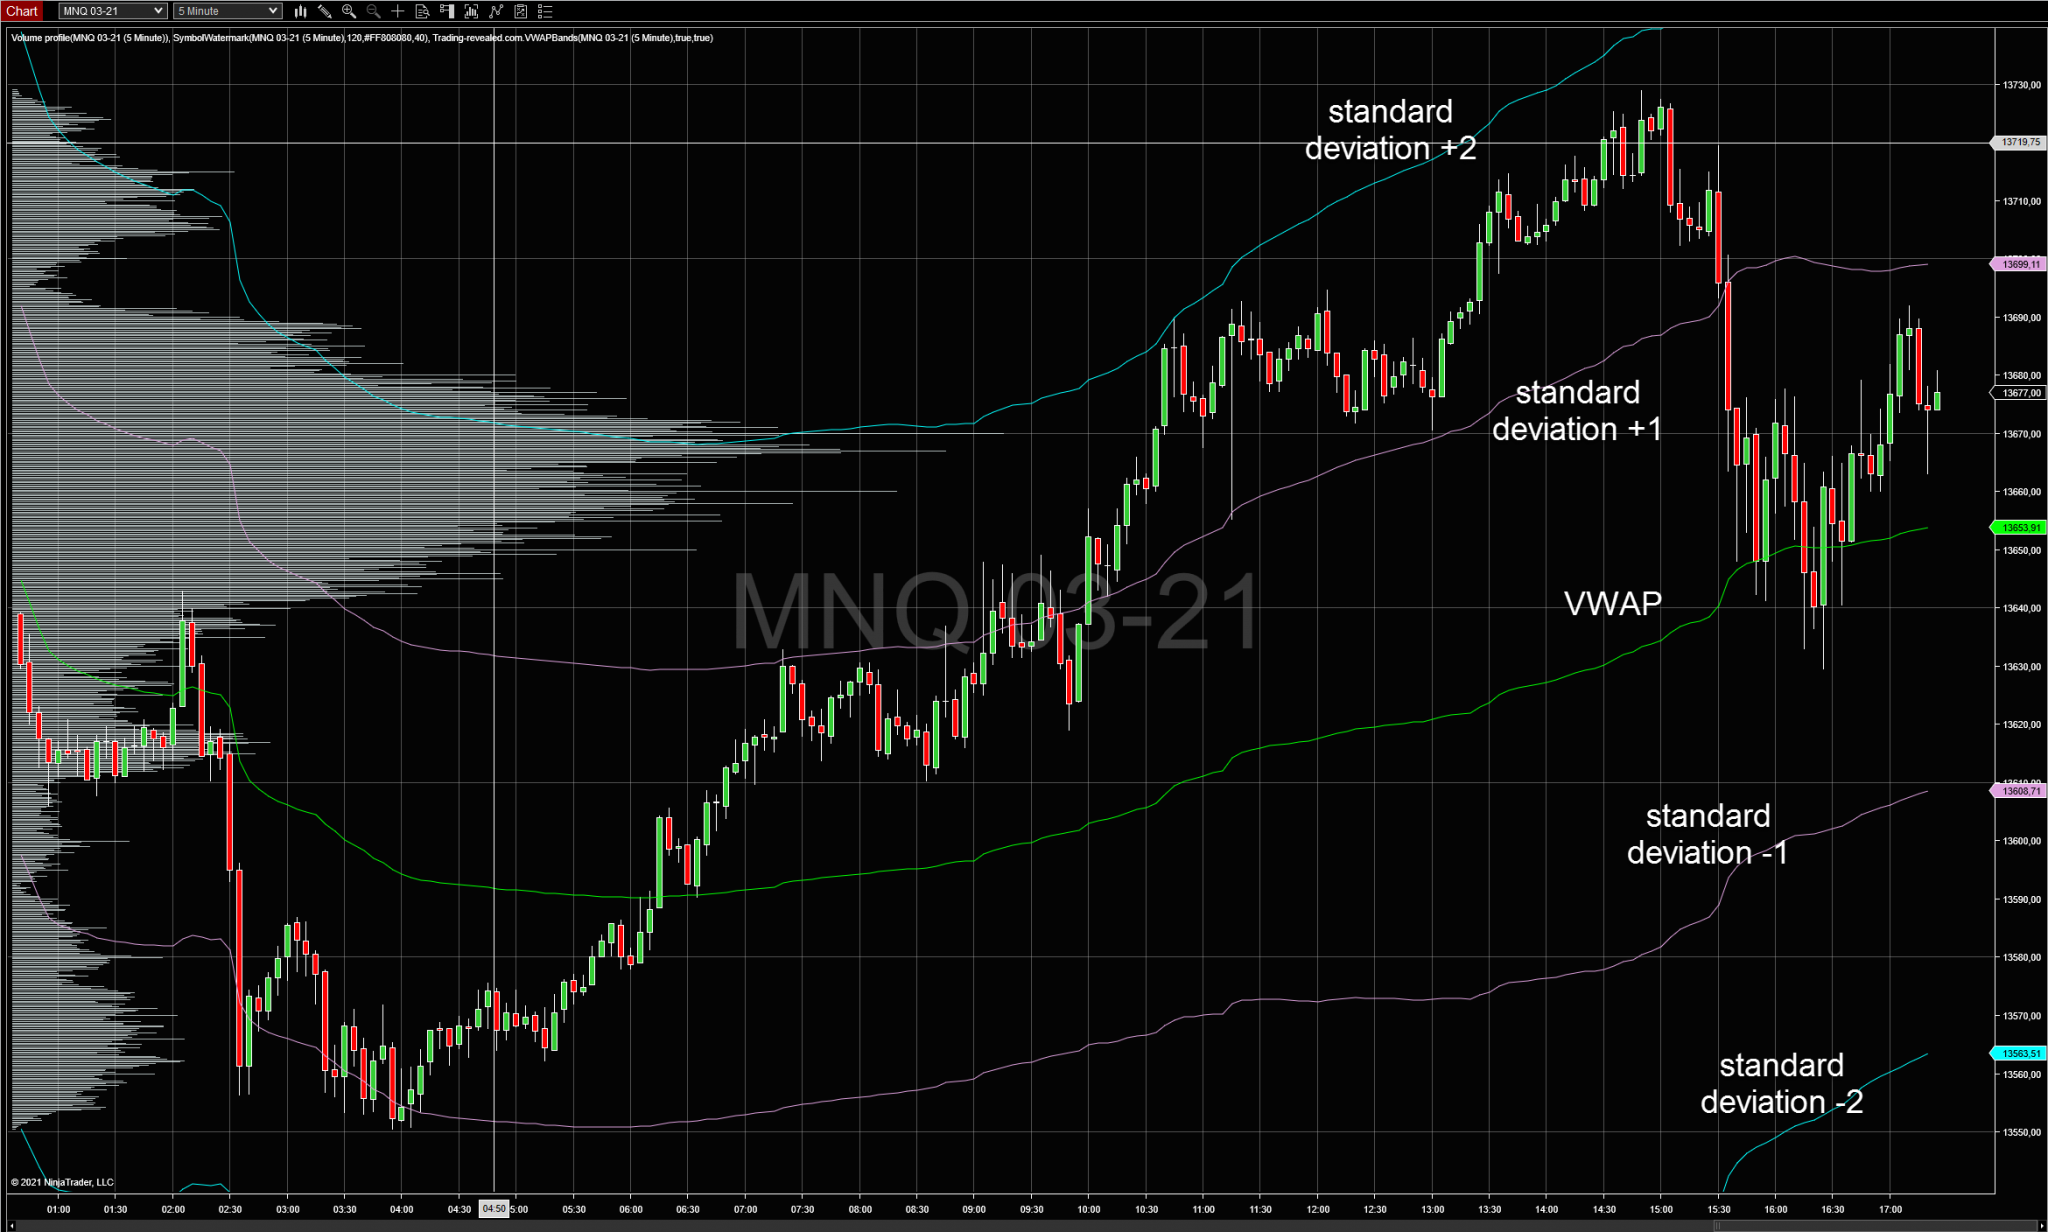
The VWAP Bands indicator that we developed for Ninjatrader 8 can display 9 lines :
- The VWAP line in green in the middle stands for “Volume Weighted Average Price” (see more about why this line is so important below)
- A standard deviation line below and above the VWAP (noted -1 and +1 in the screenshot below)
- A double standard deviation line below and above the previous lines (noted -2 and +2 in the screenshot below)
 version from Aug the 24th 2021 : the indicator can now display 4 additional lines : -3, -4 and +3, +4 lines.
Need more configurable parameters and automatic strategies usage? Check the PRO version

Why is the VWAP line important ?
The Volume Weighted Average Price is very useful because this average price is considered as a good price by trading institutions. When they have a big order to split, a good way to do this is to wait for the price to retrace back to VWAP to add to their position.
And because it is so much used, this line often acts as support/resistance.
What are the standard deviation lines for ?
The standard deviation lines 1 and 2 represent a mathematical standard deviation calculation from VWAP. Theses lines can help you to :
- see when the price is contracting or expanding because the lines will contract or expand too
- have a visual guide to where the price is. For instance, if the price is near the standard deviation +2 line, you will have to be careful while buying because you know the price is overextended already.
How to show the VWAP line only and disable the standard deviation lines?
The standard deviation lines are configurable in the indicator’s properties. You can enable and disable the standard deviation 2 lines, or the standard deviation 1 lines, or even all of them to show the VWAP line only.

Why are my chart candles contracted at the top or bottom of my window?
Ninjatrader will try to keep all the candles + all the indicator lines displayed in the same window, but when the price is overextended (ie heavily bought or sold) the candles will not be centered in the window anymore.
To solve this, you will need to uncheck the “Auto scale” parameter from the indicator properties (see previous screenshot).

Want more? We have a pro version
| Feature | FREE version | PRO version |
| Display VWAP line | X | X |
| Display/hide 4 band lines above and below VWAP | X | X |
| Can use Standard deviation for bands calculation | X | X |
| Can use static points number for bands deviation | X | |
| Can use a average true range value for bands deviation | X | |
| Standard deviation and ATR period are configurable | X | |
| All 9 lines can be used in Strategy builder (or manual coding) | X | |
| Extend previous period vwap & bands line for reference | X | |
| Improved bands calculation to fit what the big firm’s algo are using | X | |
| Configurable line labels and much more… | X |
The Pro version is a lifetime license including all futures updates and bug fixes.


bonjour
votre vwap a l air de correspondre a ce que je recherche
peut on avoir accés au choix session jour mensuel annuel?
peut on également colorer entre les bande de couleur différente
merci a vous
Bonjour,
Excusez-moi pour le délai de réponse.
Il n’y pas tout ça dans la version gratuite, mais colorer les bandes et avoir le choix de la période du vwap (jour, semaine, mois, année) sera possible dans la nouvelle version VWAP bands Pro qui sort cette semaine.
I can’t find it in NinjaTrader after loading it.
the .cs file is nothing but NinjaTrader-generated code.
Open indicators and you will see at the top a folder named “trading revealed” it is there.
Very useful, but I recommend fixing the glitch during each session break when the VWAP plot shoots up vertically if Break at EOD is unchecked in the Data Series. Probably the easiest fix would be to not plot it during that period.
Note: This happens with Renko bars.
Hello, it appears that after downloading I am only able to see 2 deviation lines above and below VWAP. Am I missing something? Thank you!
Greg
Hello,
Yes, 2 deviation lines are enabled by default. To enable more, you can go into the indicator settings and enable “Display vwap stdDev 3” and “Display vwap stdDev 3”.
Were you able to resolve this? I can only see the same stddev1 and stddev2, no option is available to add stddev3 and stddev4
I do not see your VWAP indicator listed after importing. What name should I be looking for?
Hi, I have the same question about accessing stdDev3 and stdDev4, there is no setting to enable this option. Only stddev1 and stddev2. Maybe there is and updated download that has this option? Please advise
Is this option only available in the Pro Version? Not the free one?
Yes bands 3 and 4 are available in the Pro Version only.
Greetings, What time does your VWAP reset at the end of a trading day, and is it consistent for all time zones? I’m in SE Asia and my student is in Calgary. Our VWAP levels are not aligned. In examining our charts our reset times are not in sync (time zones taken into consideration). Any suggestions?